IMAGE

Figure 2

ID
ZDB-IMAGE-250627-128
Source
Figures for Brito et al., 2025
Image
Figure Caption

Figure 2

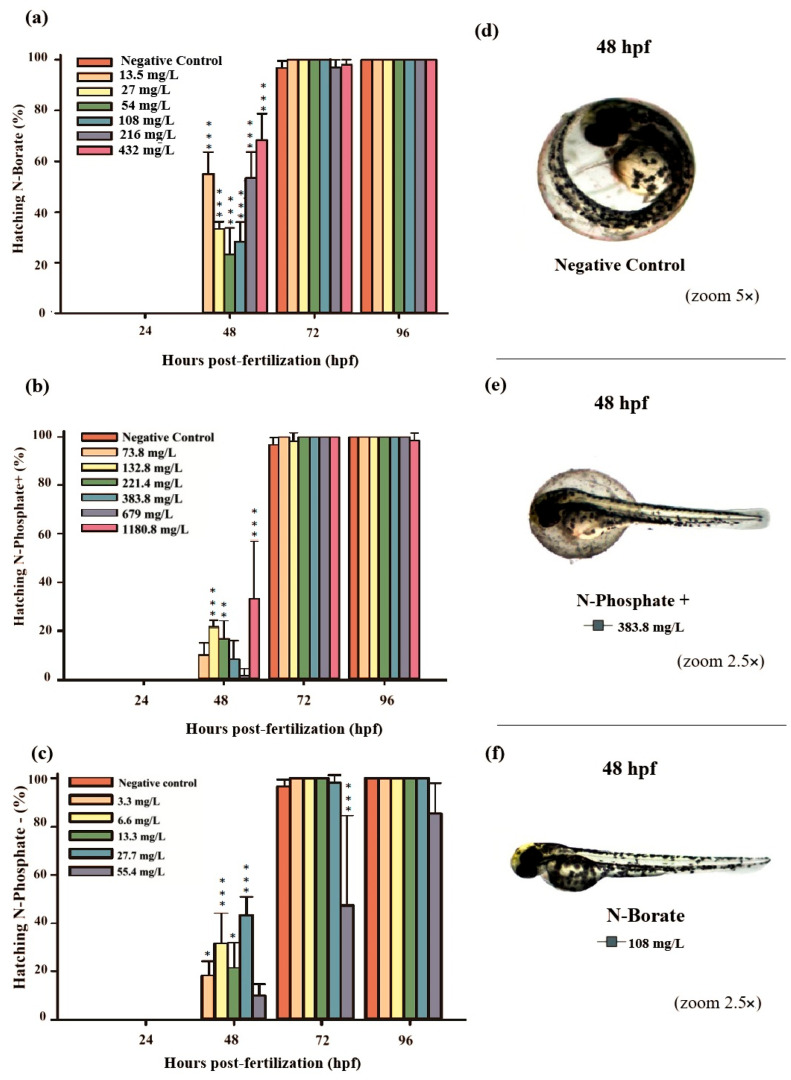
The graphs illustrate the hatching rates during the 96 h exposure period: (a) N-Borate FR, (b) N-Phosphate+ FR, and (c) N-Phosphate- FR. The negative control represents healthy embryos not exposed to fire retardants (FRs). Hatching rates are expressed as mean ± standard error. Statistical significance was determined by comparing exposed groups to the control, with significance levels indicated as follows: * (p ≤ 0.05), ** (p ≤ 0.01), and *** (p ≤ 0.001). Data visualization was performed using SigmaPlot® software, version 14.0. (d) Normal embryos, (e) partially hatched embryos, and (f) hatched embryos at 48 hpf, observed under 5× and 2.5× magnification (Stemi2000-C stereomicroscope).

Acknowledgments
This image is the copyrighted work of the attributed author or publisher, and ZFIN has permission only to display this image to its users. Additional permissions should be obtained from the applicable author or publisher of the image. Full text @ J Xenobiot