
IMAGE
Fig. 8
- ID
- ZDB-IMAGE-250627-110
- Genes
- Antibodies
- Publication
- Siegerist et al., 2025 - The differential expression of MAGI2 in glomerulopathies and its application as a molecular discriminator of podocytopathies
- All Figures
- Figures for Siegerist et al., 2025
Image
|
Figure Caption
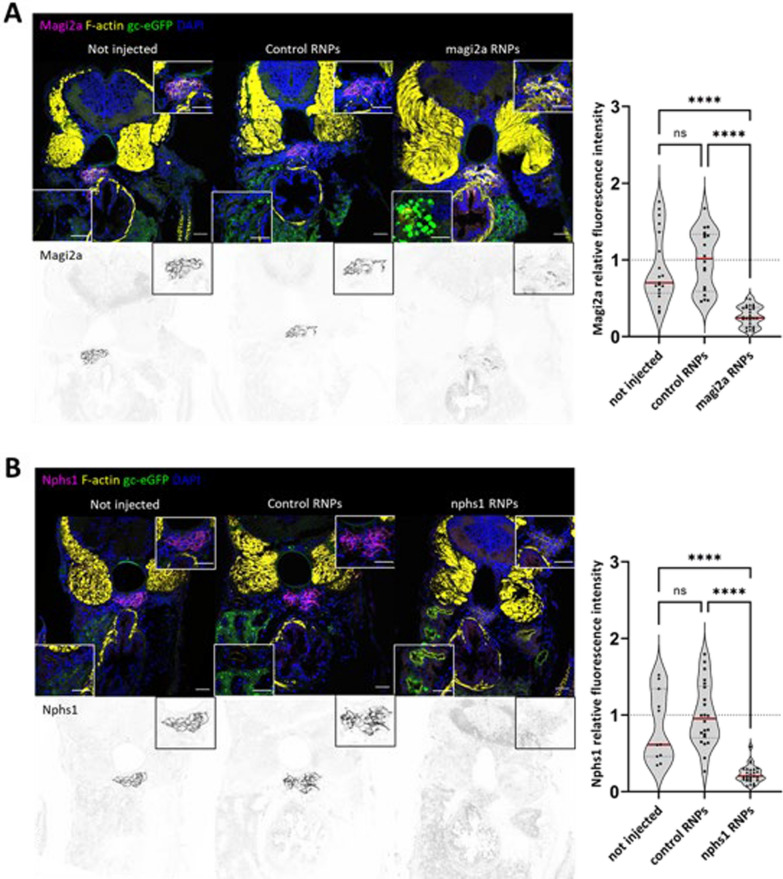
Fig. 8
Generation of magi2a and nphs1 CRISPR/Cas9 mutants.
Figure Data
Acknowledgments
This image is the copyrighted work of the attributed author or publisher, and
ZFIN has permission only to display this image to its users.
Additional permissions should be obtained from the applicable author or publisher of the image.
Full text @ J Transl Med