IMAGE

Fig. 3

ID
ZDB-IMAGE-250627-105
Source
Figures for Siegerist et al., 2025
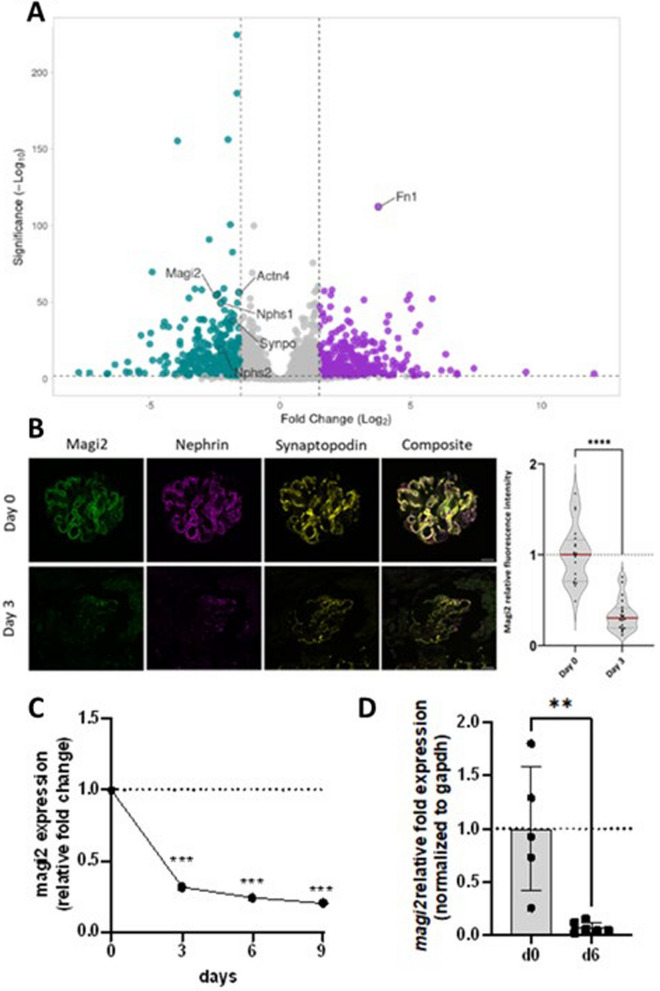
Image
Figure Caption

Fig. 3

Time course of podocyte marker and MAGI2 in isolated cultured murine glomeruli. A shows the volcano plot of a proteomic analysis of dedifferentiated glomeruli at day 6 past isolation versus fresh isolation (GlomAssay). Magi2 and other relevant podocyte marker proteins like Nphs1, Nphs2, Synpo, and Actn4 were significantly downregulated while extracellular matrix proteins like Fn1 were increased. Immunofluorescence analysis for Magi2 and Nephrin verified this phenotype with a drastic increase of Magi2 already at day 3 past isolation (B). The scale bar represents 20 µm. Both mRNA sequencing C and RT-qPCR D showed significant downregulation of Magi2 mRNA starting from 3 days post isolation

Acknowledgments
This image is the copyrighted work of the attributed author or publisher, and ZFIN has permission only to display this image to its users. Additional permissions should be obtained from the applicable author or publisher of the image. Full text @ J Transl Med