IMAGE

Fig 5

ID
ZDB-IMAGE-250620-10
Source
Figures for Ma et al., 2025
Image
Figure Caption

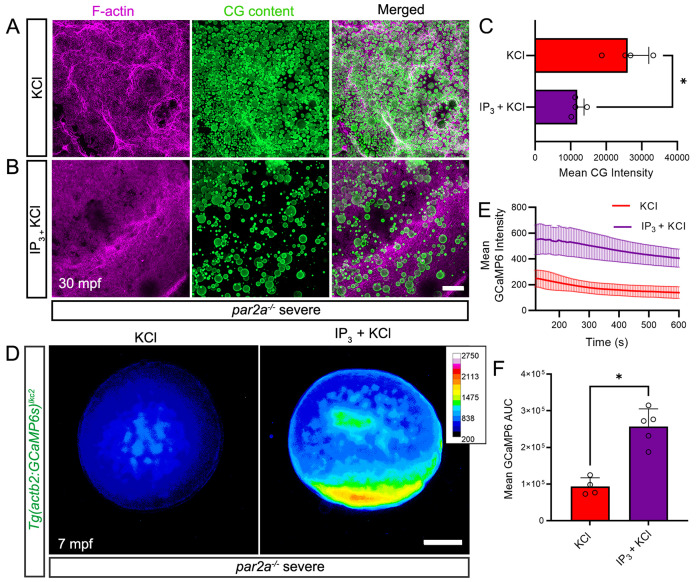
Fig 5 IP3 rescues egg activation defects by increasing intracellular calcium spatially.

A, B: Confocal images of F-actin (left; magenta), and cortical granule (middle; CG Content; green) distribution at the cortex of naturally fertilized severe par2a mutant eggs at 30 mpf. Eggs were injected with KCl alone (A) or with 20 pmol IP3 in KCl (B). C: Quantification of CG content staining intensity in fertilized severe par2a mutant eggs injected with KCl alone (red bar) or with IP3 in KCl (purple bar) n = 4; Mann–Whitney test; * = p < 0.05 D: Normalized pseudo-coloured fluorescent images of Tg(actb2:GCaMP6s)lkc2 indicating calcium levels of naturally fertilized severe par2a mutant eggs at 7 min following injection with KCl alone (left) or with IP3 in KCl (right). E: Changes in GCaMP6s intensity reported by the Tg(actb2:GCaMP6s)lkc2 transgene over 10 min in fertilized severe par2a mutants eggs following injection with KCl alone (red line) or with IP3 in KCl (purple line). F: Graph of corresponding Area Under Curve analysis of GCaMP6s levels presented in (E). n = 4, 5; Mann–Whitney test; * = p < 0.05. Scale bars B = 50 µm; D = 200 µm. See file S1 Data for underlying data.

Figure Data
Acknowledgments
This image is the copyrighted work of the attributed author or publisher, and ZFIN has permission only to display this image to its users. Additional permissions should be obtained from the applicable author or publisher of the image. Full text @ PLoS Biol.