
Image
|
Figure Caption
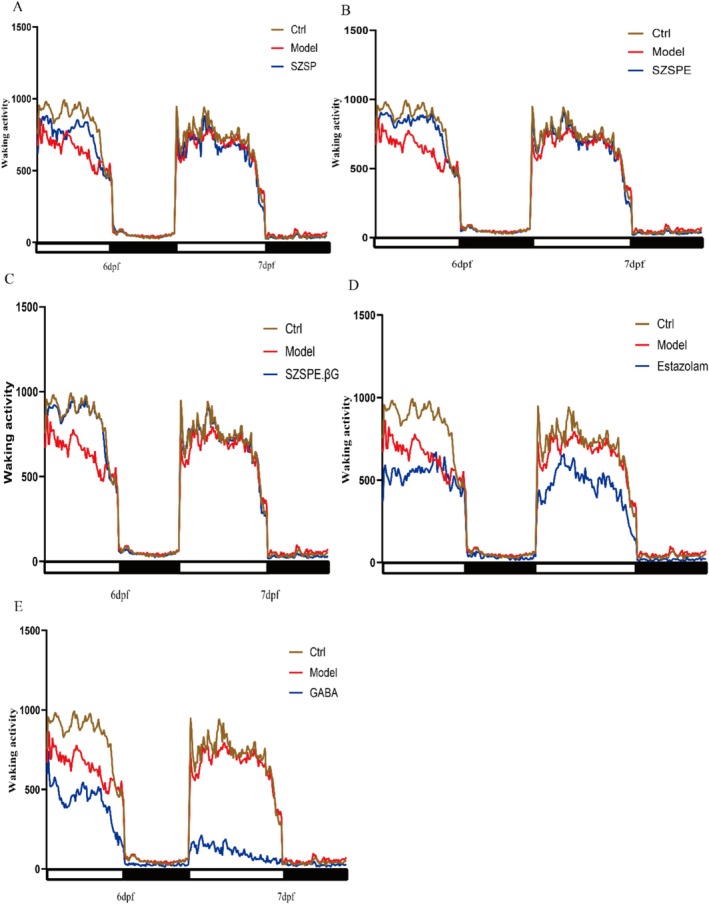
FIGURE 3
Time series analysis of waking activity. Calculated the average amount of awakening activity every 10 min, the black and white modules in the horizontal axis represent night and day, respectively. (A) SZSP; (B) SZSPE; (C) SZSPE.βG; (D) Estazolam; (E) GABA. Data are expressed as average ± SD. The same superscript letter for the same indicator indicates no significant difference,
Acknowledgments
This image is the copyrighted work of the attributed author or publisher, and
ZFIN has permission only to display this image to its users.
Additional permissions should be obtained from the applicable author or publisher of the image.
Full text @ Food Sci Nutr