IMAGE

Figure 6

ID
ZDB-IMAGE-250612-85
Source
Figures for Altenburg et al., 2025
Image
Figure Caption

Figure 6

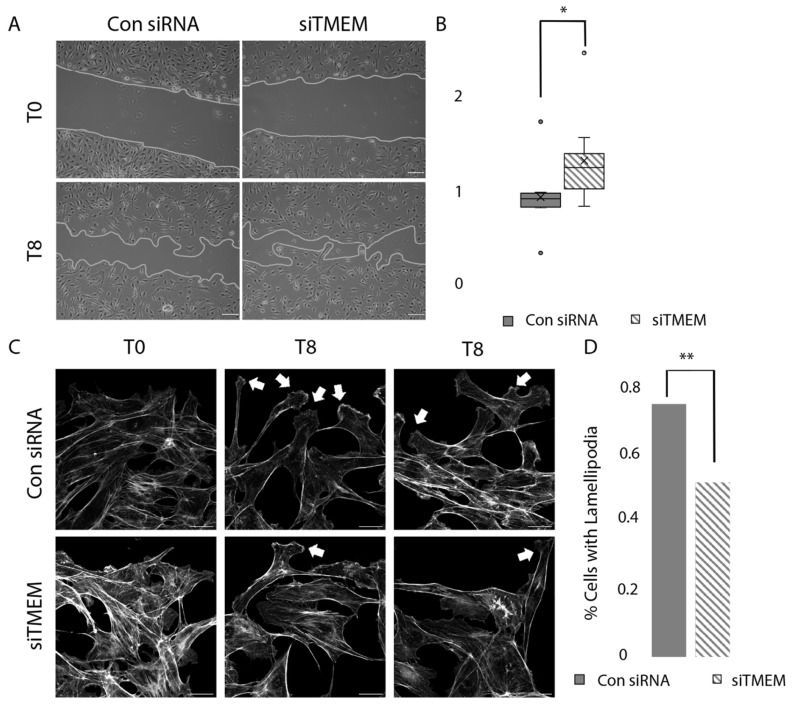
Rate of closure in siTMEM and siRNA cells. (A) Phase contrast (10×) images of transiently transfected BAOEC (siTMEM or control siRNA) cells undergoing migration 0 and 8 h post scratch. Seeded on 0.2% porcine gel; conducted in 0.2–0.5% Hi-FBS MEM media, 37 °C, and 5% CO2. The gray line indicates the leading edge of migration. Scale 100 μm. (B) Rate of closure per well (siTMEM n = 11, control siRNA n = 10) was calculated and normalized to average rate of closure for siRNA per replicate (N = 3). A Mann–Whitney U test was performed, * p < 0.05. (U = 21, p = 0.016). (C) Confocal microscopy of the leading edge at 0 and 8 h post scratch (Gray: Phalloidin) (scale 20 μm). White arrows indicate lamellipodia during cell migrating at the leading edge at T8. (D) Percentage of migratory front cells containing lamellipodia (KD n = 125, control siRNA n = 132 cells). A chi-squared test was performed ** p < 0.001.

Acknowledgments
This image is the copyrighted work of the attributed author or publisher, and ZFIN has permission only to display this image to its users. Additional permissions should be obtained from the applicable author or publisher of the image. Full text @ Cells