
|
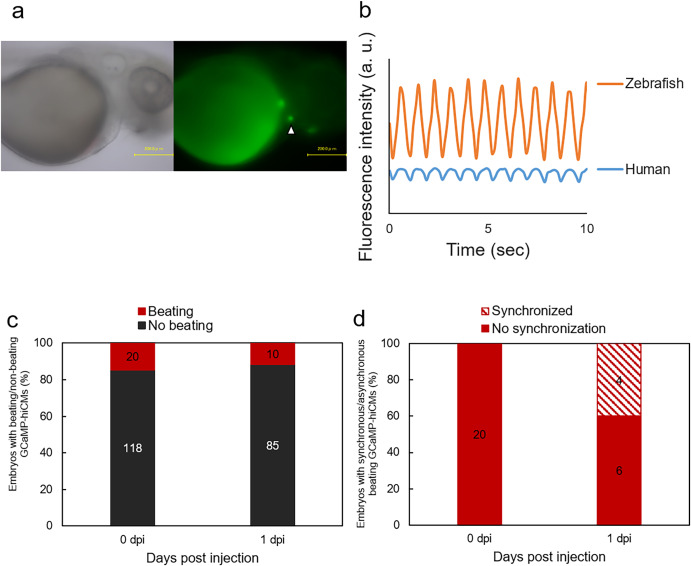
Fig. 4 Synchronous beating between transplanted GCaMP-hiCMs and host hearts. (a) Beating transplanted cells were analyzed using ImageJ. Arrowhead indicates GCaMP-hiCMs. Scale bar = 200 μm. (b) Beating host hearts and transplanted cells. Vertical axis indicates fluorescence intensity of cells in arbitrary units. (c) Vertical axis shows proportions of embryos that survived post-transplantation and emitted constant green or flickering fluorescence representing heartbeats. (d) Embryos with flickering fluorescence synchronized with host heartbeats. The numbers in the column (c, d) represent the total number of embryos obtained from 138 embryos in three independent experiments. (For interpretation of the references to colour in this figure legend, the reader is referred to the Web version of this article.)