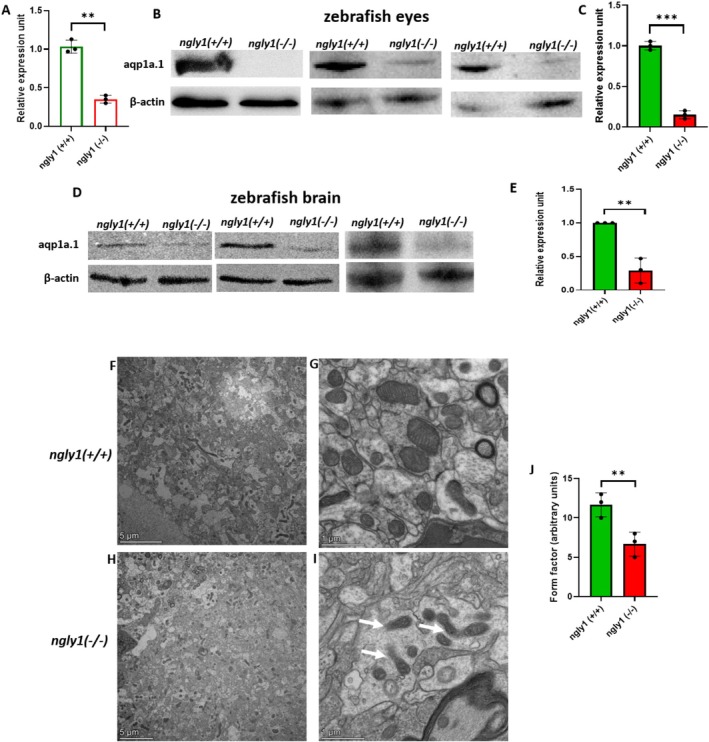
Adult ngly1(−/−)fish feature cellular effects resulting from NGLY1 deficiency. (A) RT‐qPCR quantification of aqp1a.1 mRNA levels in zebrafish eye. ** T‐test p < 0.01 (ngly1(+/+)n = 3, ngly1(−/−)n = 3). (B–E) Western blot analysis of aqp1a.1 protein from adult zebrafish eyes (B, C); *** T‐test p < 0.001 (ngly1(+/+)n = 3, ngly1(−/−)n = 3), and brain (D, E) ** T‐test p < 0.01 (ngly1(+/+)n = 3, ngly1(−/−)n = 3). β‐actin was used as a loading control. (F–I) Transmission electron microscopy images showing mitochondrial fragmentation in the mutant zebrafish brain (white arrows). (J) Fragmented mitochondria were quantified by Form Factor metric, calculated by the formula: Form Factor = (4 × π × mitochondrial area)/(mitochondrial perimeter) [2]. ** T‐test p < 0.01, (N = 3 in each group).
This image is the copyrighted work of the attributed author or publisher, and
ZFIN has permission only to display this image to its users.
Additional permissions should be obtained from the applicable author or publisher of the image.
Full text @ J. Inherit. Metab. Dis.
Your Input Welcome
Thank you for submitting comments. Your input has been emailed to ZFIN curators who may contact you if
additional information is required.
Oops. Something went wrong. Please try again later.