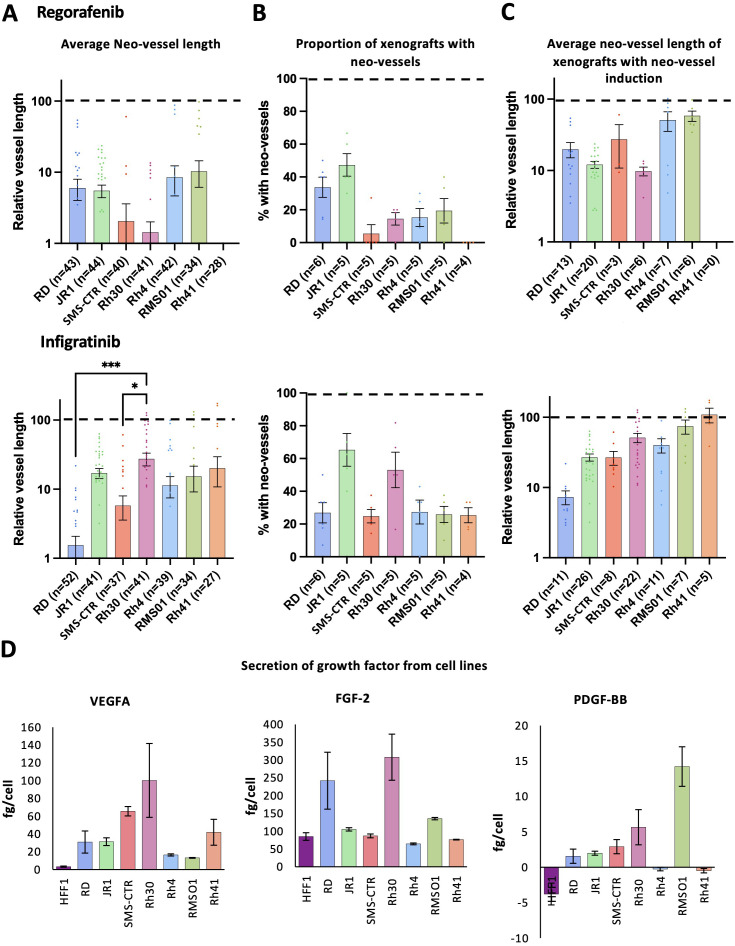
IMAGE

Figure 4

ID
ZDB-IMAGE-250607-7
Source
Figures for Wragg et al., 2025
Image
Figure Caption

Figure 4

Regorafenib and infigratinib treatment inhibits RMS xenograft tumour induced vascularisation. Xenografts generated from the 7 RMS cell lines were treated with 0.1 µM regorafenib or infigratinib for 66 hours after which vessel development was assessed by FIJI image analysis. (A), Bar graph of the effect of each treatment on tumour induced neo-vessel length overall, relative to the average vehicle treated vessel length for each cell line (dotted line 100%). (B), Bar graph of the proportion of xenografts with tumour induced neo-vessels, upon drug treatment. (C), Bar graphs of average length of tumour induced neo-vessel, of those where neo-vessels were induced, relative to the average vehicle treated vessel length for each cell line. * P<0.05, *** P<0.001, Ordinary one-way ANOVA with Tukey’s multiple comparison’s test, Data are presented as mean values +/- SEM. (D), Bar graphs showing the amount of secreted VEGFA, FGF-2 and PDGF-BB secreted in 24hrs in vitro by each cell line, assessed by ELISA of conditioned media. n = number of xenografts (except for B, which is number of experiments).

Acknowledgments
This image is the copyrighted work of the attributed author or publisher, and ZFIN has permission only to display this image to its users. Additional permissions should be obtained from the applicable author or publisher of the image. Full text @ Front Oncol