IMAGE

Figure 2

ID
ZDB-IMAGE-250607-5
Source
Figures for Wragg et al., 2025
Image
Figure Caption

Figure 2

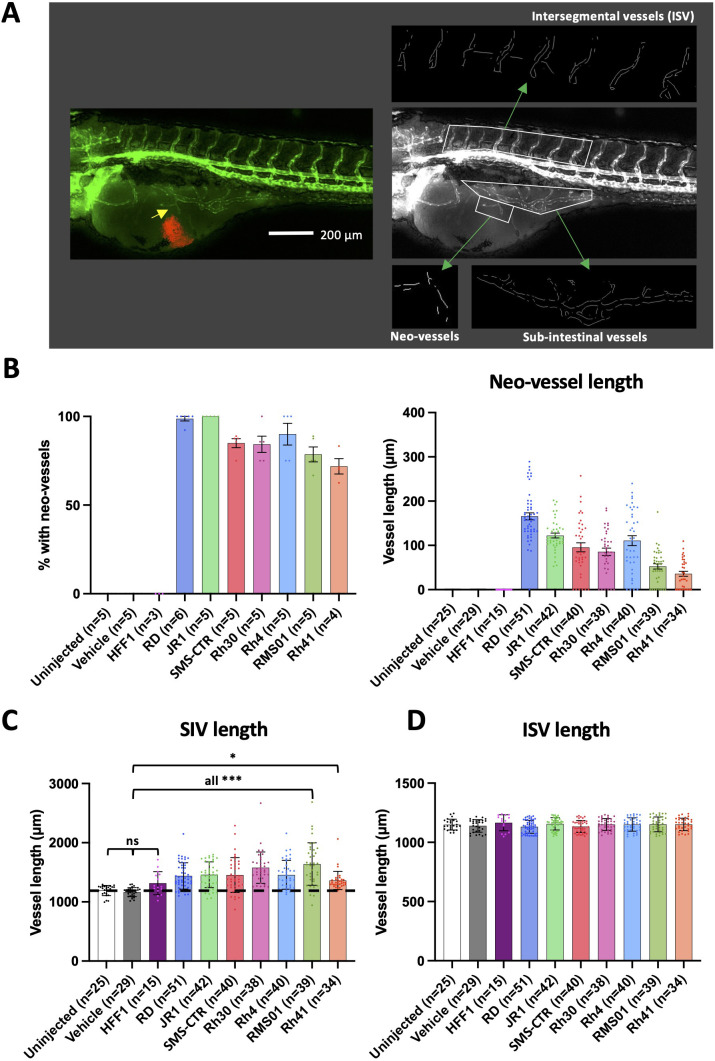
RMS tumours induce neo-vascularisation from proximal vessel beds. (A), Schematic illustrating the calculation of sub-intestinal, intersegmental and tumour induced neo-vessel lengths, by Fiji image analysis. An image of a 120 hpf (70 hpi) zebrafish xenograft in flk1-GFP background is shown with blood vessels shown in green and the RMS tumour in red. From this, the green fluorescence channel is taken, GFP +ve vessels skeletonised and their lengths measured. (B), Bar graphs showing the proportion of xenografts with neo-vessel induction for xenografts generated from each RMS cell line (left) and the average neo-vessel length for xenografts generated from each RMS cell line (right). (C, D), Bar graphs showing the average sub-intestinal vessel length (excluding neo-vessels) (C) and the average intersegmental vessel length (D) for xenografts generated from each RMS cell line. Dotted line indicates level of vehicle only injected zebrafish controls. * P<0.05, *** P<0.001, Ordinary one-way ANOVA with Tukey’s multiple comparison’s test, Data are presented as mean values +/- SEM. n = number of xenografts (except for B left, which is number of experiments).

Acknowledgments
This image is the copyrighted work of the attributed author or publisher, and ZFIN has permission only to display this image to its users. Additional permissions should be obtained from the applicable author or publisher of the image. Full text @ Front Oncol