
|
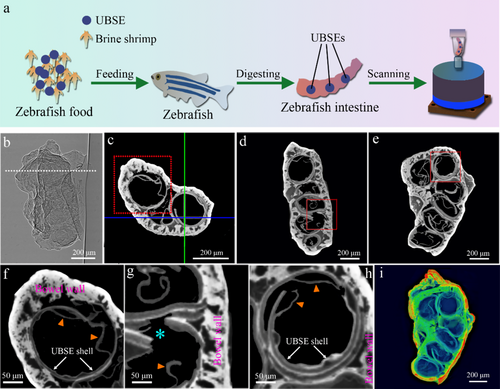
Fig. 5 High-resolution visualization of UBSEs in zebrafish intestine after 24 h of feeding. (a) Schematic of the experimental design. Zebrafish food contained most brine shrimp and some UBSEs was fed to zebrafish. After 24 h of digestion, the zebrafish intestines were harvested and scanned using PCCT. (b) Projection image of a section of zebrafish intestine. (c) Axial slice of the sample at the level marked by the white dotted line in (b). (d) Sagittal view marked by the green line in (c). (e) Coronal view marked by the blue line in (c). The images clearly show that the section of intestine was filled with UBSEs. (f–h) are magnified images of the regions in the red boxes shown in (c), (d), and (e), respectively. The images reveal that the UBSE shells were ruptured (asterisk in g) and layers were separated (orange arrowheads in f–h). (i) Colored sectional view provided a clear visualization of the UBSEs in the intestine.