
Image
|
Figure Caption
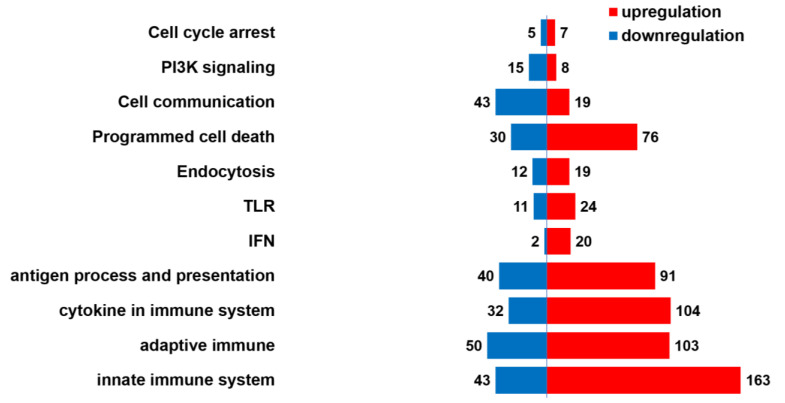
Figure 4
Segregation of the DEGs according to signaling pathways in the reactome database. DEGs were categorized based on their association with signaling pathways related to pathogen infection.
Acknowledgments
This image is the copyrighted work of the attributed author or publisher, and
ZFIN has permission only to display this image to its users.
Additional permissions should be obtained from the applicable author or publisher of the image.
Full text @ Viruses