
Image
|
Figure Caption
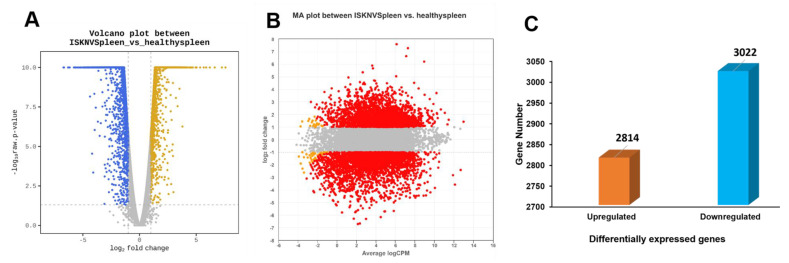
Figure 3
Visualization of DEGs between ISKNV-infected and healthy ASB spleen tissues. (
Acknowledgments
This image is the copyrighted work of the attributed author or publisher, and
ZFIN has permission only to display this image to its users.
Additional permissions should be obtained from the applicable author or publisher of the image.
Full text @ Viruses