
Image
|
Figure Caption
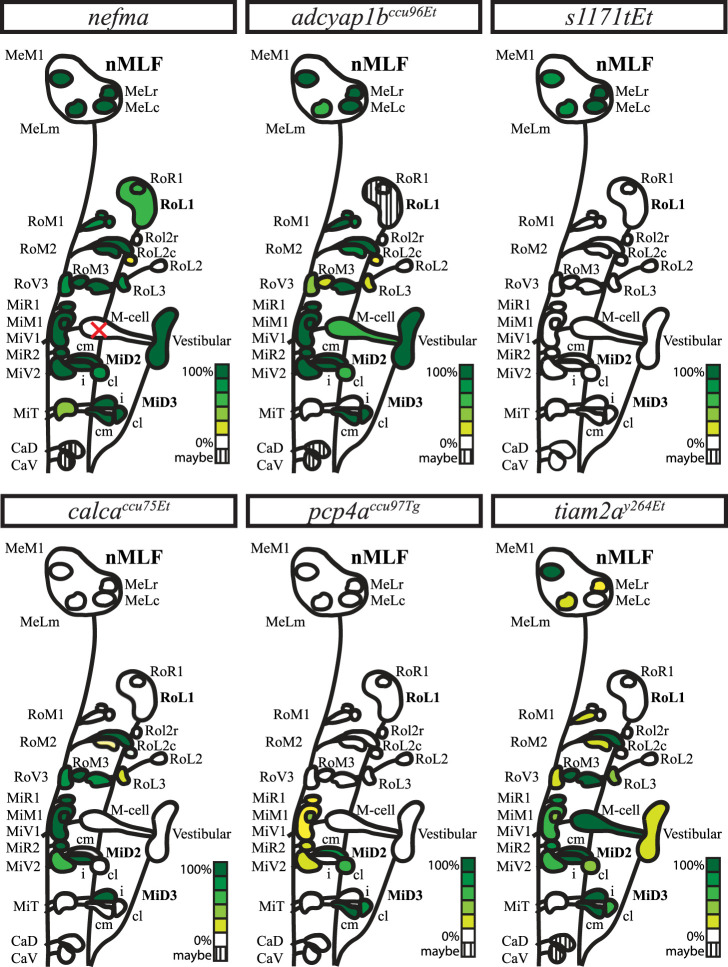
Figure 6.
Graphical summary of the number of RSNs labeled in each transgenic line across multiple fish.
Acknowledgments
This image is the copyrighted work of the attributed author or publisher, and
ZFIN has permission only to display this image to its users.
Additional permissions should be obtained from the applicable author or publisher of the image.
Full text @ eNeuro