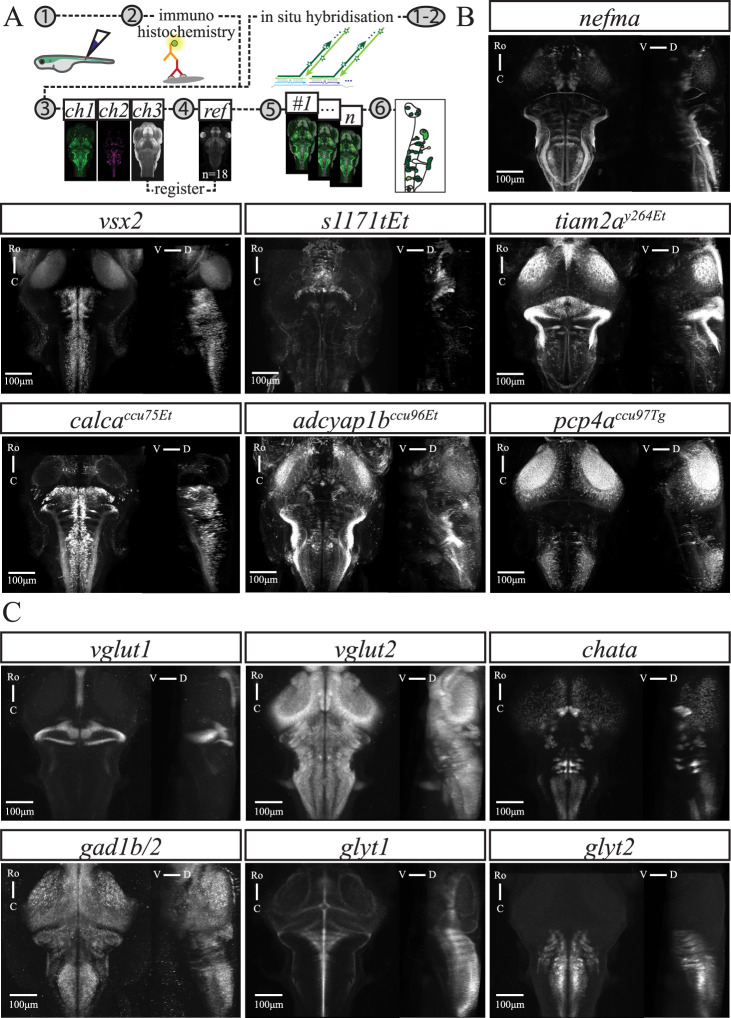
Overview of transgenic lines and neurotransmitter-associated gene expression patterns. A, Graphical summary of methods for reticulospinal backfills paired with immunohistochemistry (left) or in situ hybridization (right), followed by confocal imaging, image registration to an average reference brain, and analysis. B, GCaMP expression in transgenic lines used in this study as indicated in each panel. C, Expression of genes associated with neurotransmitter phenotypes as indicated in each panel. For B and C, each panel shows a maximum intensity projection (MIP) from the dorsal and sagittal views, taken from average stack following image registration. Number of fish: nefman = 7, calcaccu75Etn = 12, vsx2n = 11, s1171tEtn = 5, pcp4accu97Tgn = 6, adcyap1bccu96Etn = 8, tiam2ay264Etn = 6, vglut1n = 16, vglut2n = 13, chatan = 8, gad1b/2n = 4, glyt1n = 16, and glyt2n = 15. Scale bar 100 μm. For brainwide expression patterns in example fish from selected transgenic lines, see Extended data Figure 1-1.
Acknowledgments
This image is the copyrighted work of the attributed author or publisher, and
ZFIN has permission only to display this image to its users.
Additional permissions should be obtained from the applicable author or publisher of the image.
Full text @ eNeuro
Your Input Welcome
Thank you for submitting comments. Your input has been emailed to ZFIN curators who may contact you if
additional information is required.
Oops. Something went wrong. Please try again later.