
Image
|
Figure Caption
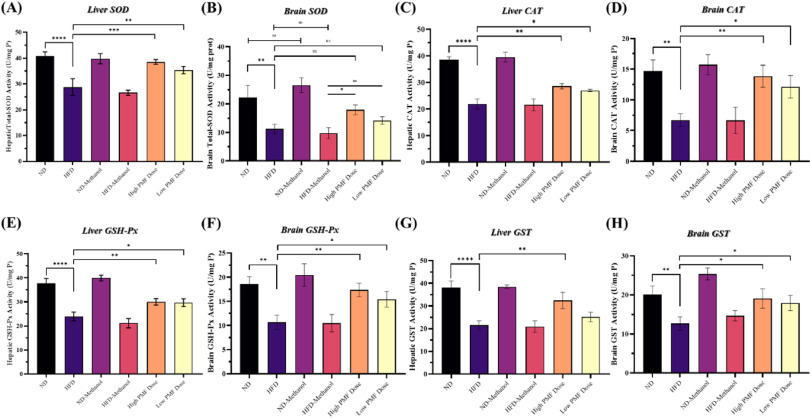
Fig. 12 Effects of PMF on Antioxidative enzyme activities. (A–B) Liver and brain Total-SOD levels (Liver: n = 4, Brain: n = 5). (C–D) Liver and brain CAT levels (Liver: n = 5, Brain: n = 4). (E–F) Liver and brain GSH-Px levels (Liver: n = 7, Brain: n = 4). (G–H) Liver and brain GST activity (Liver: n = 6, Brain: n = 4). All values are means (±SD) in triplicates. Statistical analyses were performed using One-Way ANOVA followed by post-test Tukey multiple comparison and significant p-values were indicated as ∗P<0.05, ∗∗P<0.01, ∗∗∗P<0.001 and ∗∗∗∗P < 0.0001. ND: normal diet, HFD: high-fat diet.
Acknowledgments
This image is the copyrighted work of the attributed author or publisher, and
ZFIN has permission only to display this image to its users.
Additional permissions should be obtained from the applicable author or publisher of the image.
Reprinted from Molecular and Cellular Endocrinology, , Vohra, M.S., Ahmad, B., Taylor, E.R., Benchoula, K., Fong, I.L., Parhar, I.S., Ogawa, S., Serpell, C.J., Wong, E.H., 5,7,3',4',5'-Pentamethoxyflavone (PMF) Exhibits Anti-Obesity and Neuroprotective Effects in an Obese Zebrafish Model, 112554112554, Copyright (2025) with permission from Elsevier. Full text @ Mol. Cell. Endocrinol.