
|
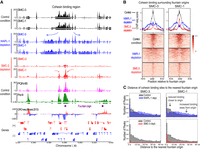
Fig. 4 Cohesin spreads from fountain origins. (A) Genome browser view around fountain origins. Plotted are the input-subtracted ChIP-seq tracks for cohesin subunits, SMC-3 and SMC-1, in three conditions: control (black), WAPL-1 depletion (blue), and SMC-3 depletion (red). The ticks below the signal tracks indicate MACS2-called peaks. Fountain origins are shown in purple. (B) Average profile and heatmap of SMC-3 and SMC-1 with respect to fountain origins. Plotted are the input-subtracted ChIP-seq tracks for the cohesin subunits SMC-3 and SMC-1 in three conditions: control (black), WAPL-1 depletion (blue), and SMC-3 depletion (red). (C) Histogram of distance between cohesin subunit summit and the nearest fountain origin. The three conditions are control (gray), WAPL-1 depletion (blue), and SMC-3 depletion (red). Change in cohesin binding sites upon WAPL-1 depletion is consistent between SMC-1 and SMC-3 and is highlighted in the panel corresponding to SMC-1.