
Image
|
Figure Caption
Figure 6
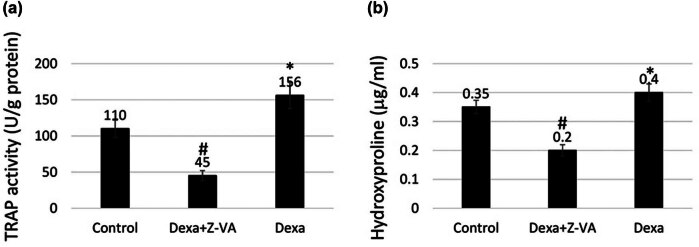
TRAP and hydroxyproline activity. Illustration of the impact of TRAP (a) and hydroxyproline content (b) in the regenerated scales upon treatment with anti-osteoporotic Z-VA in an osteoporosis-induced zebrafish model. *indicates a significant increase compared to control/Dexa, while #indicates a significant decrease compared to control (
Acknowledgments
This image is the copyrighted work of the attributed author or publisher, and
ZFIN has permission only to display this image to its users.
Additional permissions should be obtained from the applicable author or publisher of the image.
Full text @ Open Life Sci