
Image
|
Figure Caption
Figure 3
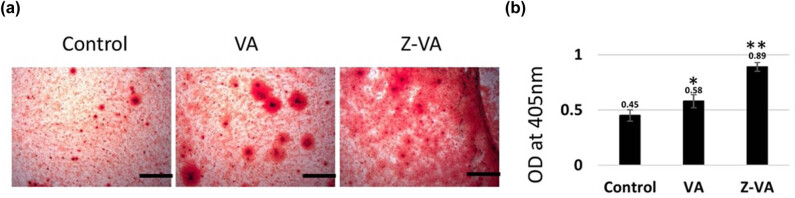
Mineralization assay on stem cell differentiation. (a) Alizarin red S red staining of mouse MSCs (C3H10T1/2) showing calcium mineralization during week 1. Photomicrographs clearly illustrating the formation of mineralized nodules in differentiated osteoblasts. Scale bar: 25 µm. (b) Bar diagram displaying absorbance values (405 nm) for Z-VA on Alizarin red S staining during 7 days compared to untreated control/VA. *Statistically significant compared to control (
Acknowledgments
This image is the copyrighted work of the attributed author or publisher, and
ZFIN has permission only to display this image to its users.
Additional permissions should be obtained from the applicable author or publisher of the image.
Full text @ Open Life Sci