
Image
|
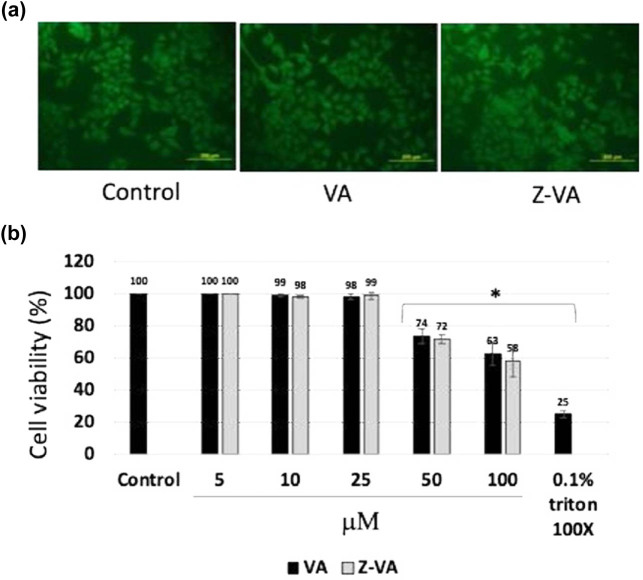
Figure Caption
Figure 1
VA and Z-VA biocompatibility assay in mouse MSCs. (a) Photomicrographs illustrating matured osteoblast cells stained with FDA after 1 week of MSC differentiation. (b) Results of the MTT assay depicting the toxicity profile of VA or Z-VA. Scale bar: 200 µm.
Acknowledgments
This image is the copyrighted work of the attributed author or publisher, and
ZFIN has permission only to display this image to its users.
Additional permissions should be obtained from the applicable author or publisher of the image.
Full text @ Open Life Sci