
|
Fig 1
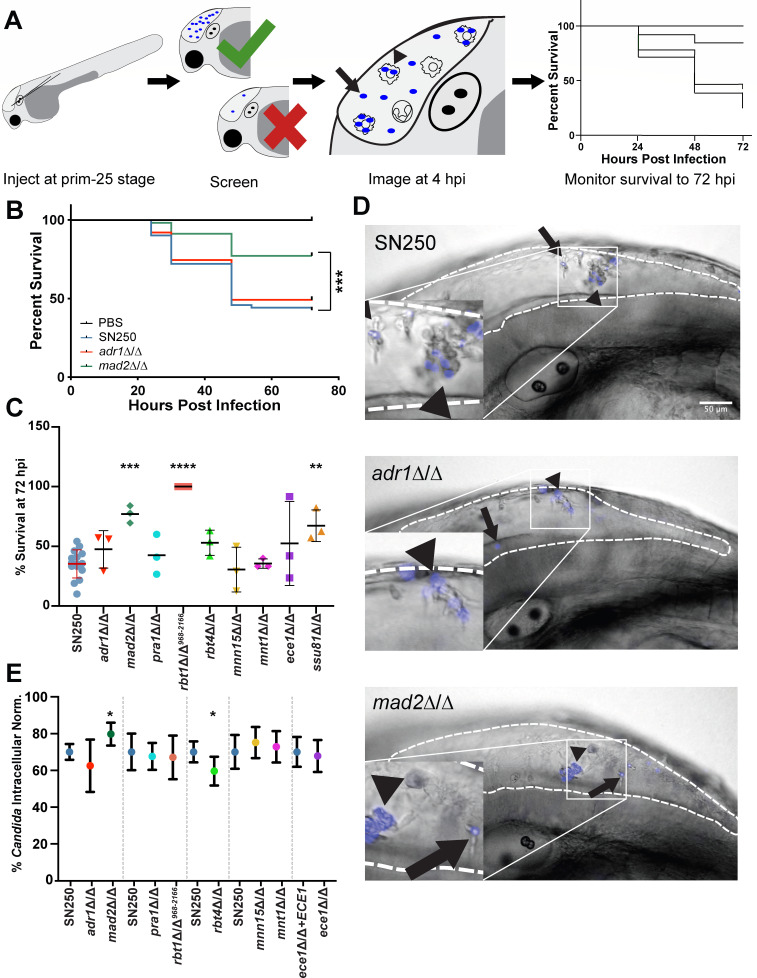
Defining infection parameters. (A) Flow chart showing the workflow of pilot experiments. Hindbrain infections were performed at the prim-25 stage, and fish were then screened to ensure they received the correct inoculum (10–25 cells). At 4–6 hours postinfection, fish were imaged by confocal microscopy to score fungal phagocytosis; survival was monitored out to 72 hpi. (B) Example Kaplan-Meier survival curves pooled from three experiments showing the fish injected with PBS (control,