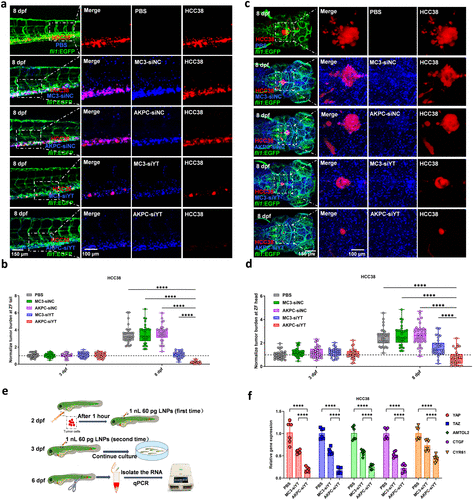
Fig. 6 Therapeutic antitumor effect of AKPC-siYT in vivo on HCC38 xenografts. a, Confocal image of HCC38-mCherry tumor burden (in red) with LNPs-siRNA (in blue) in the circulation of zebrafish at 8 dpf. Green represents vessels of zebrafish embryos. b, The relative intensity of red fluorescence (the ratio of fluorescence intensity of each group at 8 dpf to that of the PBS group at 3 dpf) was used to measure tumor burden at CHT sites of zebrafish at 3 dpf and 8 dpf (n = 30/group). c, Confocal image of HCC38 tumor burden with LNPs-siRNA in the hindbrain at 8 dpf. d, The relative intensity of red fluorescence (the ratio of fluorescence intensity of each group at 8 dpf to that of the PBS group at 3 dpf) was used to measure tumor burden in the hindbrain of zebrafish at 3 and 8 dpf (n = 30/group). Two-way ANOVA multiple comparisons were used to determine the significance of the comparisons of data indicated in b and d (*p < 0.05; **p < 0.01; ***p < 0.001; ****p < 0.0001). In all panels, error bars represent mean ± s.d. e, Schematic representation of RNA isolation of tumor cells from the tail of zebrafish and RT-PCR detection. f, RT-PCR results of YAP/TAZ and downstream gene expression in zebrafish after codelivery of siYAP and siTAZ at 8 dpf. Two-way ANOVA was used to determine the significance of the comparisons of data (*p < 0.05; **p < 0.01; ***p < 0.001; ****p < 0.0001). In all panels, error bars represent mean ± s.d. (n = 3).
Image
Figure Caption
Acknowledgments
This image is the copyrighted work of the attributed author or publisher, and
ZFIN has permission only to display this image to its users.
Additional permissions should be obtained from the applicable author or publisher of the image.
Full text @ ACS Nano

