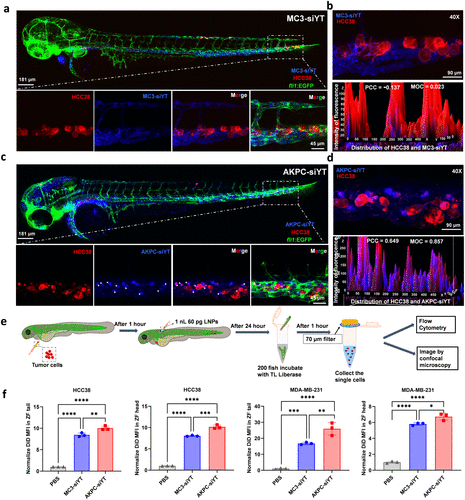
Fig. 3 In vivo tumor targeting of LNPs to HCC38 cells in zebrafish. a,c, HCC38 cells (in red), stably expressing mCherry, were implanted into the circulation of 2 dpf fli1/EGFP (in green) zebrafish. One hour later, 0.2 mol % DiD (far-red fluorescence) labeled LNPs (1 nL, 60 pg siRNA) (in blue) were injected into the circulation of zebrafish by DoC. SP8 Confocal measured the tumor targeting of LNPs to tumor cells in the zebrafish circulatory system 4 h after LNP injection. b,d, Colocalization of HCC38 and LNPs in the circulation of zebrafish. ImageJ was used to analyze the distribution of LNPs in the cell area, and the cell fluorescence intensity and LNP fluorescence intensity in the cell area were calculated at the same time. PCC (Pearson correlation coefficient): 1 indicates perfect correlation; 0 indicates random distribution; −1 indicates that colocalization is completely excluded. MOC (Manders overlap coefficient): the value can be 0–1, where 1 indicates complete overlap and 0 indicates complete separation. (81−83) e, Schematic diagram of the isolation of tumor cells from zebrafish. f, Flow cytometry analysis of LNPs uptake in HCC38 and MDA-MB-231 transplanted in the zebrafish tail and head. The DiD mean fluorescence intensity was normalized to the PBS group for the quantification of LNPs uptake by HCC38 and MDA-MB-231 cells. An ordinary one-way ANOVA multiple comparison was used to determine the significance of data indicated in f (*p < 0.05; **p < 0.01; ***p < 0.001; ****p < 0.0001). In all panels, error bars represent mean ± s.d. (n = 3).
Image
Figure Caption
Acknowledgments
This image is the copyrighted work of the attributed author or publisher, and
ZFIN has permission only to display this image to its users.
Additional permissions should be obtained from the applicable author or publisher of the image.
Full text @ ACS Nano

