
Image
|
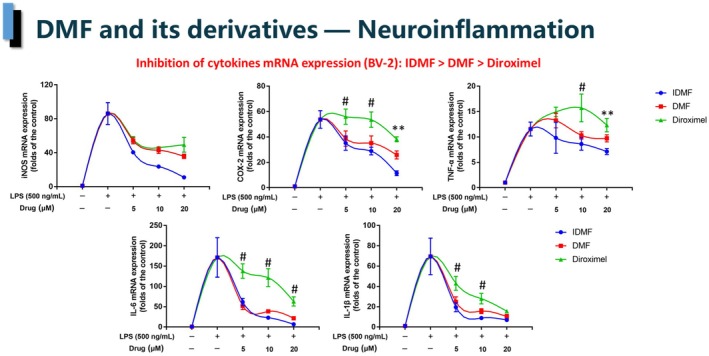
Figure Caption
Figure 2
DMF and its derivatives inhibit the expression of iNOS, COX‐2, TNF‐α, IL‐1β and IL‐6 in LPS‐stimulated BV‐2 cells unequally, as determined by RT‐PCR. *
Acknowledgments
This image is the copyrighted work of the attributed author or publisher, and
ZFIN has permission only to display this image to its users.
Additional permissions should be obtained from the applicable author or publisher of the image.
Full text @ FEBS Open Bio