
Image
|
Figure Caption
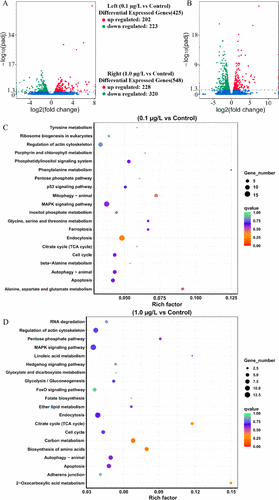
Fig. 2 Transcriptomic alterations in F1 generation larvae. (A) Volcano plot of DEGs in F1 generation embryos of zebrafish parents exposed to 0.1 μg/L difenoconazole; (B) volcano plot of DEGs in F1 generation embryos of zebrafish parents exposed to 1.0 μg/L difenoconazole. (C) Compared with control, KEGG enrichment analysis of DEGs in the 0.1 μg/L difenoconazole group. (D) Compared with control, KEGG enrichment analysis of DEGs in the 1.0 μg/L difenoconazole group.
Acknowledgments
This image is the copyrighted work of the attributed author or publisher, and
ZFIN has permission only to display this image to its users.
Additional permissions should be obtained from the applicable author or publisher of the image.
Full text @ Env. Sci. Tech.