
Image
|
Figure Caption
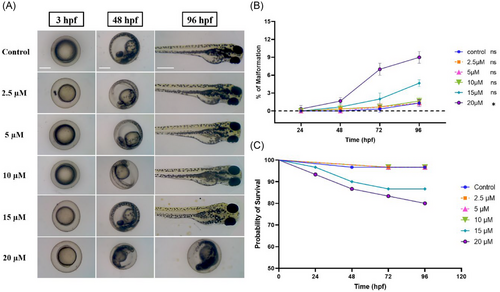
Fig. 2 Toxicity effects of DOPA-33 compounds. The graph represents (A) the embryotoxicity of the DOPA-33 compound at various stages, such as 24, 48, and 96 hpf. (B) Percentage of malformation. (C) The survival rate of DOPA-33-exposed embryo. All the assays were conducted in triplicates as three independent experiments. hpf = hours post fertilization. Scale bar = 100 µm.
Acknowledgments
This image is the copyrighted work of the attributed author or publisher, and
ZFIN has permission only to display this image to its users.
Additional permissions should be obtained from the applicable author or publisher of the image.
Full text @ Biotechnol Appl Biochem