
|
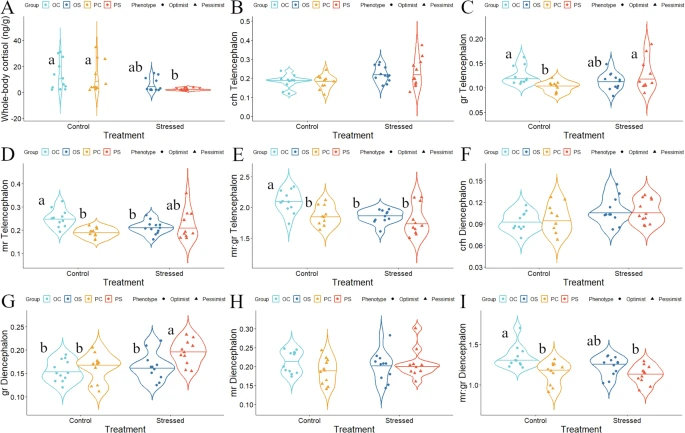
Fig. 3 Differential levels of HPI axis-related factors between optimistic and pessimistic zebrafish.Differential levels of a comprehensive set of factors associated with the HPI axis between judgment bias-related phenotypes exposed to the effects of chronic stress (n = 12 per experimental group: optimists control, pessimists control, optimists stress, and pessimists stress). A Cortisol; B crh expression in the telencephalon; C gr expression in the telencephalon; D mr expression in the telencephalon; E mr/gr ratio in the telencephalon; F crh expression in the diencephalon; G gr expression in the diencephalon; H mr expression in the diencephalon; I mr/gr ratio in the diencephalon. Different letters indicate significant differences between the experimental groups following planned comparisons tests. Data are expressed as mean ± s.e.m.