
|
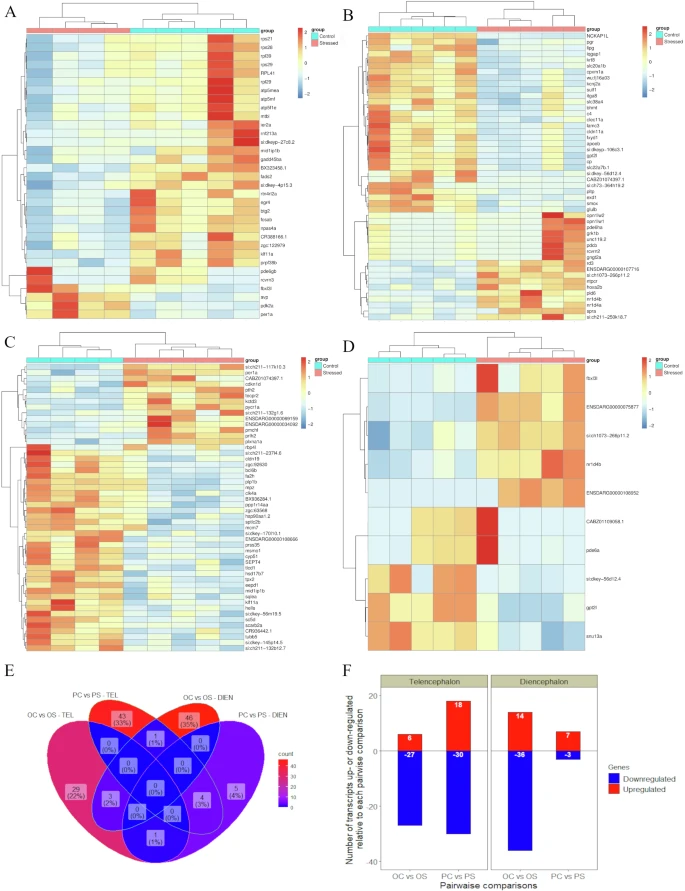
Fig. 2 Chronic stress-driven changes in the brain of optimistic and pessimistic zebrafish.Chronic stress-driven changes in gene expression in the brain of judgment bias-related phenotypes (n = 5 per experimental group: optimists control, pessimists control, optimists stress, and pessimists stress). A Hierarchical clustering of optimistic individuals from each treatment (control versus stress; columns) and of DEG (lines) in the telencephalon; B Hierarchical clustering of pessimistic individuals from each treatment (control versus stress; columns) and of DEG (lines) in the telencephalon; C Hierarchical clustering of optimistic individuals from each treatment (control versus stress; columns) and of DEG (lines) in the diencephalon; D Hierarchical clustering of pessimistic individuals from each treatment (control versus stress; columns) and of DEG (lines) in the diencephalon. Heatmaps represent normalized gene expression levels (red, high expression; blue, low expression); E Venn diagram showing the number of DEG shared between each control group and their stressed counterparts (control versus stress) in the telencephalon and diencephalon; F Total number of DEG up- and down-regulated relative to each control group and their stressed counterparts (control versus stress) in the telencephalon and diencephalon.