
Fig. 1
- ID
- ZDB-IMAGE-250430-159
- Publication
- Luo et al., 2025 - OPN3-mediated positive regulation of angiogenesis in HUVECs through VEGFR2 interaction
- All Figures
- Figures for Luo et al., 2025
|
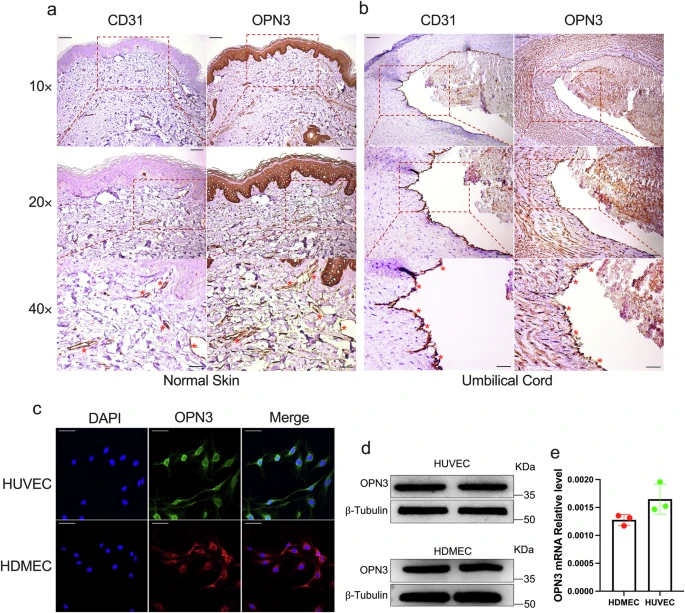
Fig. 1 OPN3 expression in primary human vascular endothelial cells: HUVECs and HDMECs.a IHC staining of human skin tissue for CD31 and OPN3. CD31 positively marks dermal microvascular endothelial cells in human skin tissue, while OPN3 staining shows its expression in human skin, with higher expression observed in the basal layer of the epidermis. Comparing with the CD31-positive areas, OPN3-positive reactions were found in the same locations, indicating that OPN3 is expressed in HDMECs. The scale bar in the 10× panel corresponds to 100 μm, while the scale bar in the 20× panel represents 50 μm, and the scale bar in the 40× panel indicates 25 μm. Red asterisks indicate the locations of HDMECs. b IHC staining of human umbilical vein tissue for CD31 and OPN3. CD31 positively marks endothelial cells in the human umbilical vein tissue, while OPN3 staining shows its expression in the umbilical vein. Comparing with the CD31-positive areas, OPN3-positive reactions were found in the same locations, indicating that OPN3 is expressed in HUVECs. The scale bar in the 10× panel corresponds to 100 μm, while the scale bar in the 20× panel represents 50 μm, and the scale bar in the 40× panel indicates 25 μm. Red asterisks indicate the locations of HUVECs. c Laser confocal microscopy analysis of OPN3 protein expression and localization in HUVECs and HDMECs. Green indicates OPN3 in HUVECs, red indicates OPN3 in HDMECs, and blue represents the nucleus. The results show that OPN3 protein is mainly located on the plasma membrane. The scale bar represents 50 μm. d Western blot analysis of OPN3 protein expression in HDMECs and HUVECs, with β-tubulin used as a loading control for normalization of the WB analysis. e RT-qPCR analysis of OPN3 mRNA expression in HDMECs and HUVECs. The relative mRNA expression levels were calculated using the 2−ΔCt method, with GAPDH serving as the internal control (n = 3 independent experiments, with each experimental group consisting of 6 dishes, derived from 3 different donors, with each donor providing 2 dishes of cells).