
|
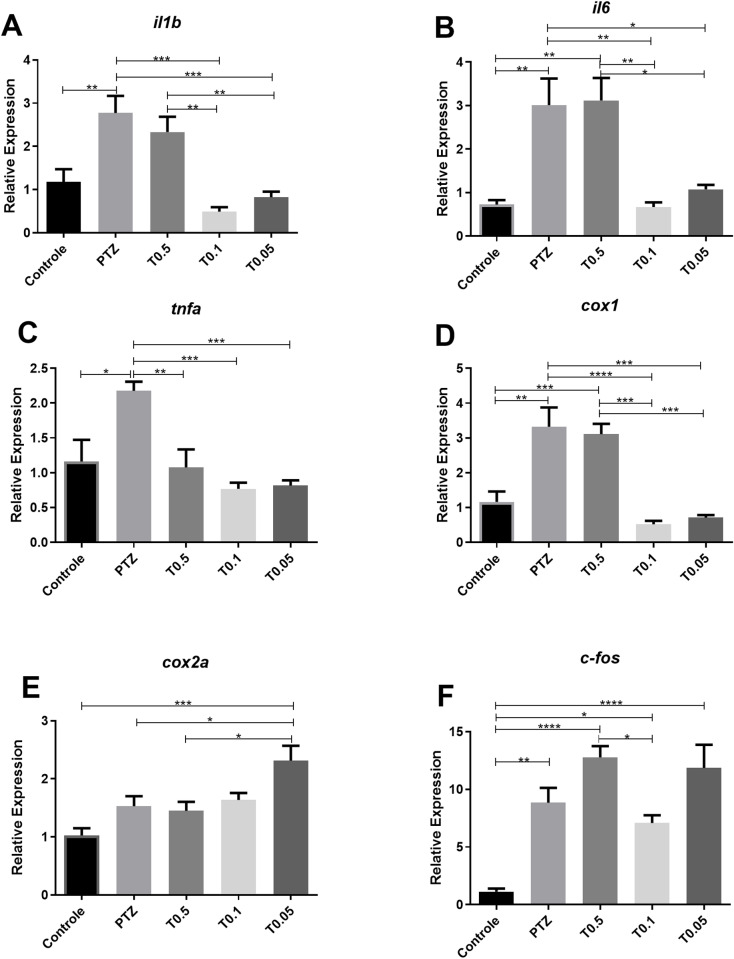
Fig 4
Expression levels of
Each treatment group was pre-exposed to CX2 for 24 h, followed by exposure to 15 mM PTZ for 20 min. Control and PTZ groups underwent identical procedures but were exposed to water only (n = 5 per group). Data are presented as mean ± SEM. Statistical analyses were performed with the one-way ANOVA, followed by Bonferroni’s multiple comparisons test. Differences were significant at p<0.05. Significance indicators: *p≤0.05; **p≤0.01; ***p≤0.001; ****p≤0.0001. Groups: Control (Control), PTZ (pentylenetetrazol group), T0.5 (0.5 µM treatment), T0.1 (0.1 µM treatment), T0.05 (0.05 µM treatment).