
|
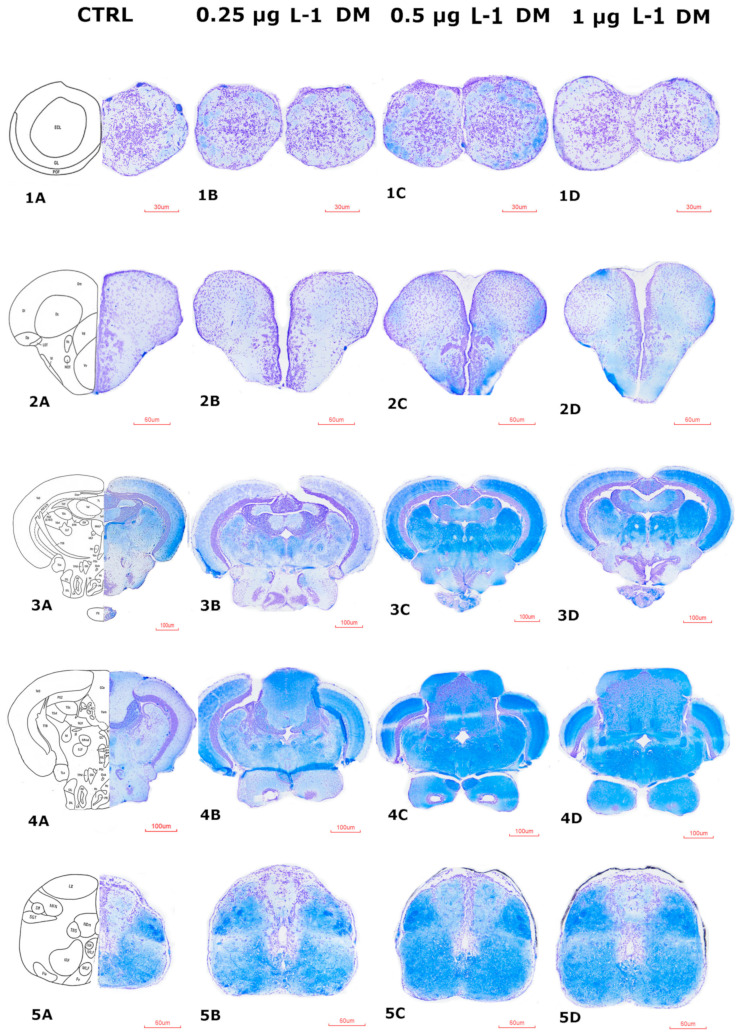
Figure 12
Histological sections of key brain regions of control and DM-exposed fish. Representative cross-sections illustrating the structural organization of different brain regions in zebrafish from the control group and those exposed to increasing concentrations of deltamethrin (DM). Panels (