
Image
|
Figure Caption
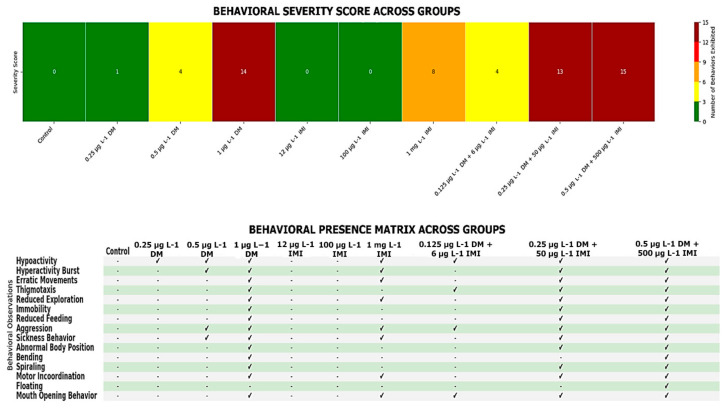
Figure 1
Behavioral severity across experimental groups—the top panel presents a heatmap illustrating the severity score for each experimental group, where colors represent the number of behavioral abnormalities observed (green = low, red = high). The bottom panel displays a behavioral presence matrix, indicating the presence (✔) or absence (-) of specific behavioral abnormalities across experimental groups. The severity score was calculated based on the total number of distinct behaviors exhibited within each group (n = 10 per group).
Acknowledgments
This image is the copyrighted work of the attributed author or publisher, and
ZFIN has permission only to display this image to its users.
Additional permissions should be obtained from the applicable author or publisher of the image.
Full text @ Life (Basel)