IMAGE

Figure 5

ID
ZDB-IMAGE-250428-107
Source
Figures for Ye et al., 2025
Image
Figure Caption

Figure 5

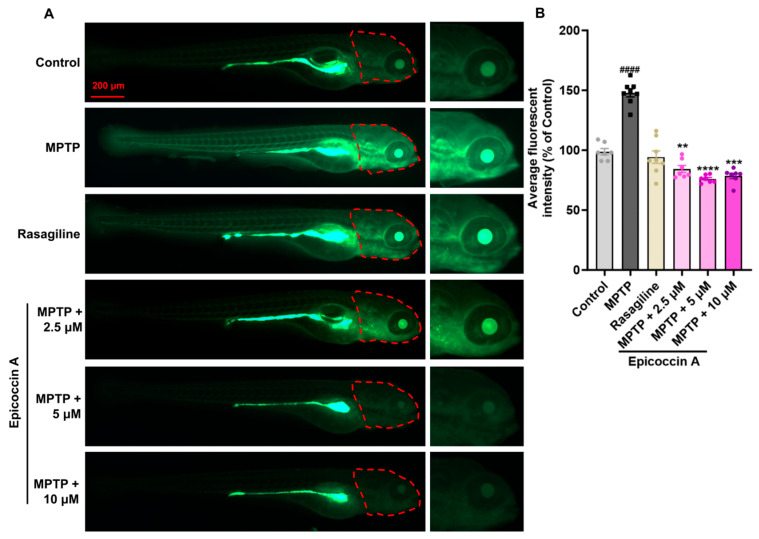
The inhibitory effect of epicoccin A on ROS overproduction in the brains of zebrafish with PD. (A) Fluorescent images depicting ROS levels in zebrafish larvae from control, MPTP, rasagiline, and epicoccin A plus MPTP co-treatments. Enlarged images are provided for clear visualization. Scale bar, 200 µm. (B) Quantification of fluorescent intensity representing ROS levels in the brains (as indicated by red dotted lines) of zebrafish larvae in each group, n = 8. The data are presented as mean ± SEM; ####p < 0.0001 compared to the control group; ** p < 0.01, *** p < 0.001, and **** p < 0.0001 compared to the MPTP group.

Acknowledgments
This image is the copyrighted work of the attributed author or publisher, and ZFIN has permission only to display this image to its users. Additional permissions should be obtained from the applicable author or publisher of the image. Full text @ Mar. Drugs