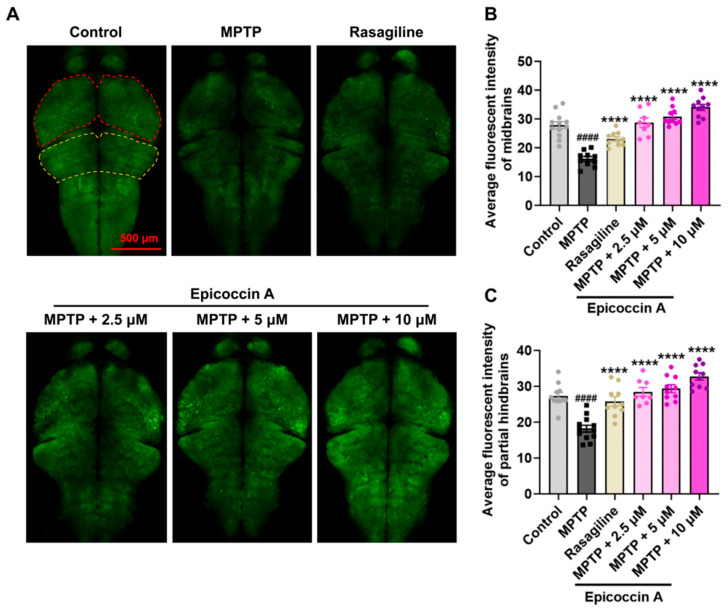
The inhibitory effect of epicoccin A on MPTP-induced nervous system injury in zebrafish brains. (A) Representative fluorescent microscopy images of elavl3:EGFP zebrafish from the control, MPTP, rasagiline, and epicoccin A plus MPTP co-treatment groups. Scale bar, 500 μm. (B) Statistical analysis of the average fluorescent intensity in the midbrain regions (as indicated by red dotted lines) of zebrafish in each group, n = 8. (C) Statistical analysis of the average fluorescent intensity in the partial hindbrain regions (as indicated by yellow dotted lines) of zebrafish in each group, n = 8. The data are presented as mean ± SEM; ####p < 0.0001 compared to the control group; **** p < 0.0001 compared to the MPTP group.
Acknowledgments
This image is the copyrighted work of the attributed author or publisher, and
ZFIN has permission only to display this image to its users.
Additional permissions should be obtained from the applicable author or publisher of the image.
Full text @ Mar. Drugs
Your Input Welcome
Thank you for submitting comments. Your input has been emailed to ZFIN curators who may contact you if
additional information is required.
Oops. Something went wrong. Please try again later.