
|
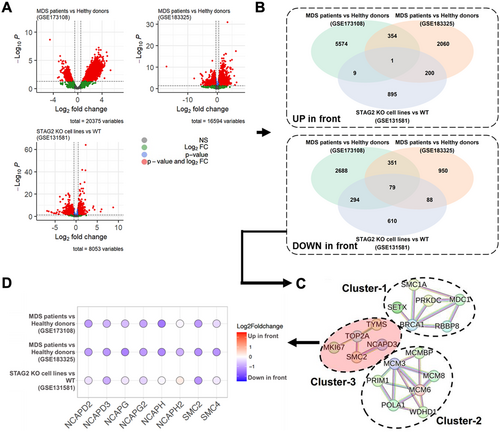
Fig. 1 Selection procedure of target proteins using RNA-seq datasets of MDS-associated samples via three different comparisons. (A) Volcano plots of significantly differentially expressed MDS-associated genes for the three comparisons: (i) MDS patients versus healthy donors (GSE173108), (ii) MDS patients versus healthy young adults (GSE183325), and (iii) STAG2 knock-out (KO) HL-60 cells versus WT HL-60 cells (GSE131581). (B) Venn diagrams comparing the three DEGs for up/downregulations. (C) Protein–protein interaction (PPI) networks connected using significant DEGs. (D) Transcriptional profiles of the condensin family across the three comparisons.