
|
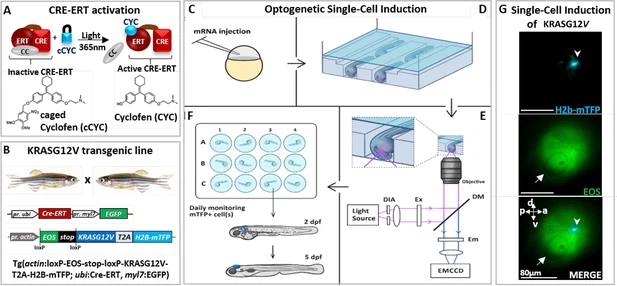
Fig. 1 Optogenetic setup for single-cell induction. (A) Photocontrol of a protein fused to an estrogen receptor (ERT) is achieved by releasing the protein from its complex with cytoplasmic chaperones (CC), upon uncaging of caged cyclofen (cCYC). (B) The transgenic zebrafish line engineered to express an oncogene (KRASG12V) upon photoactivation of a CRE-recombinase fused to ERT (CRE-ERT) (as shown in A). (C) The mRNAs of Ventx-GR and mRFP (used as a marker) are injected at the one-cell stage. (D) At 1 day post-fertilization (dpf) the embryos are mounted in channels in an agarose gel and incubated for 45 min in cCYC on a microscope stage. (E) They are washed and illuminated at 405 nm on a microscope to uncage cCYC close to the otic vesicle. A diaphragm (DIA) defines an illumination zone of ~80 μm diameter (see G). Excitation (EX), dichroic mirrors (DM), and emission (EM) filters allow for visualization of Eos and mTFP. The cell in which KRASG12V has been induced is observed within ~1 hr by the fluorescence of mTFP (see G). (F) The embryos are transferred into individual wells, incubated overnight in dexamethasone (DEX), washed at 1 day post-induction (dpi) and monitored over the next 5 days. (G) Lateral view of zebrafish at ~1 hr post-activation displays a single induced cell (top: blue spot shown by arrowhead in mTFP channel) in the illumination region (middle: Eos channel) in the vicinity of the otic vesicle (white arrow) and bottom: merger of both channels. Body axes (a: anterior; p: posterior; d: dorsal; v: ventral) are shown.