
Image
|
Figure Caption
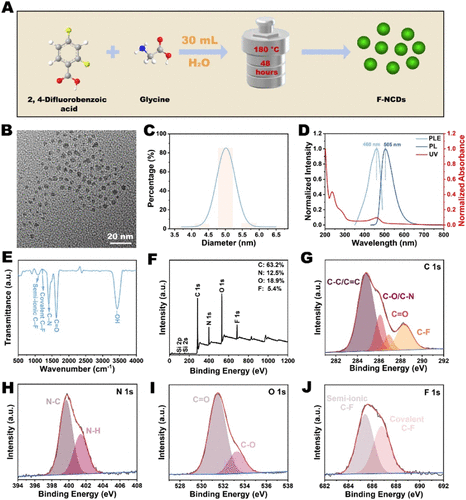
Fig. 1 (A) Schematic illustration of the preparation of F-NCDs. (B) TEM image of F-NCDs. (C) Diameter distribution of F-NCDs. (D) UV–vis absorption, excitation, and emission spectra of F-NCDs. (E) FTIR spectrum of F-NCDs. (F) XPS full spectrum, (G) high-resolution C 1s, (H) N 1s, (I) O 1s, and (J) F 1s XPS spectrum of F-NCDs.
Acknowledgments
This image is the copyrighted work of the attributed author or publisher, and
ZFIN has permission only to display this image to its users.
Additional permissions should be obtained from the applicable author or publisher of the image.
Full text @ Anal. Chem.