
|
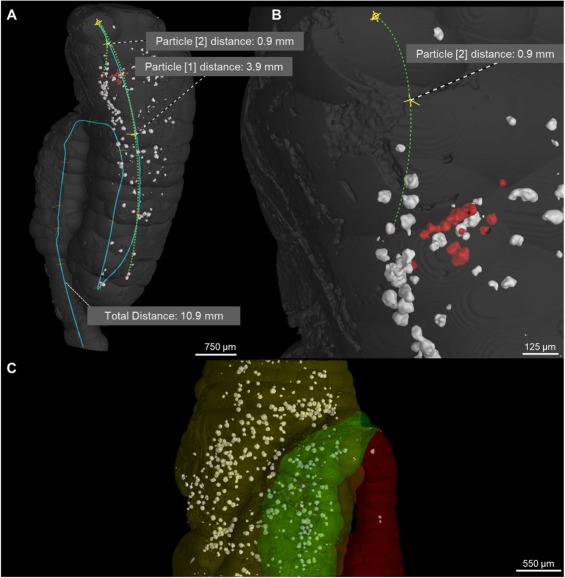
Fig. 9 Quantitative analysis was performed on two randomly selected MPs inside the gut. (A) For each particle, the distance from the start of the gut was measured (represented by the green dash line). The blue line indicates the total distance from the beginning to the end of the gut. Particles located near the villi were marked in white, while those closer to the centre of the gut were highlighted in red. (B) A closer look on the particle analysis as well as the classification of particles’ location. (C) Moreover, three intestinal segments as anterior (yellow), middle (green) and posterior (red) were divided for calculation of MP abundance in different intestinal regions.
Reprinted from Journal of hazardous materials, 488, Parobková, V., Maleček, L., Zemek, M., Kalčíková, G., Vykypělová, M., Buchtová, M., Adamovský, O., Zikmund, T., Kaiser, J., Advancing microplastic detection in zebrafish with micro computed tomography: A novel approach to revealing microplastic distribution in organisms, 137442137442, Copyright (2025) with permission from Elsevier. Full text @ J. Hazard. Mater.