
|
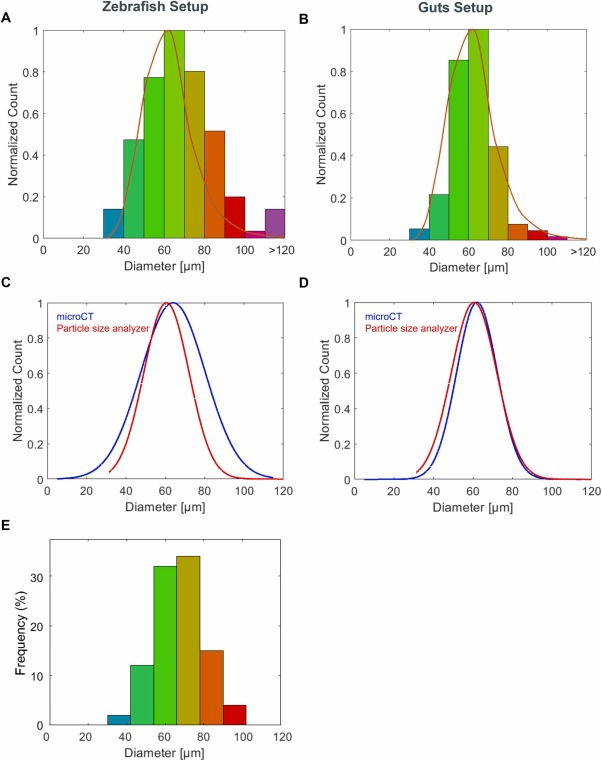
Fig. 6 Particle size distribution analysis comparing microCT and particle size analyser measurement – Zebrafish and Guts. CT measurements were conducted on reference samples using two different CT setups. (A) Normalized size distribution for the Zebrafish Setup, with the microCT data represented as a histogram and the particle size distribution overlaid as a curve. (B) The corresponding size distribution for the Guts Setup follows the exact representation. (C, D) Fitted Gaussian distributions comparing microCT (blue) and particle size analyser (red) data for the Zebrafish and Guts Setups, respectively. (E) Results of the particle size analyser with particle diameters' frequency (bars) and cumulative number distribution (black line).
Reprinted from Journal of hazardous materials, 488, Parobková, V., Maleček, L., Zemek, M., Kalčíková, G., Vykypělová, M., Buchtová, M., Adamovský, O., Zikmund, T., Kaiser, J., Advancing microplastic detection in zebrafish with micro computed tomography: A novel approach to revealing microplastic distribution in organisms, 137442137442, Copyright (2025) with permission from Elsevier. Full text @ J. Hazard. Mater.