
Image
|
Figure Caption
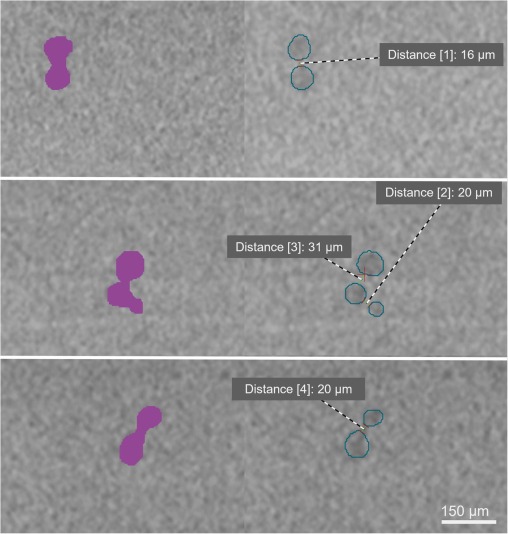
Fig. 5 Examples of segmented particles which tended to form clusters due to their proximity (left). Particles were segmented manually (blue circles, right), allowing for the tolerance of their boundaries. Distances between neighbouring particles were measured to determine how close were the particles when they started to cluster.
Acknowledgments
This image is the copyrighted work of the attributed author or publisher, and
ZFIN has permission only to display this image to its users.
Additional permissions should be obtained from the applicable author or publisher of the image.
Reprinted from Journal of hazardous materials, 488, Parobková, V., Maleček, L., Zemek, M., Kalčíková, G., Vykypělová, M., Buchtová, M., Adamovský, O., Zikmund, T., Kaiser, J., Advancing microplastic detection in zebrafish with micro computed tomography: A novel approach to revealing microplastic distribution in organisms, 137442137442, Copyright (2025) with permission from Elsevier. Full text @ J. Hazard. Mater.