
Image
|
Figure Caption
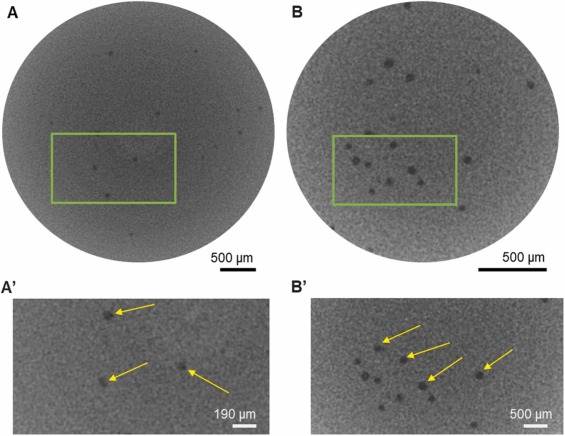
Fig. 3 MicroCT data acquired using the (A) Zebrafish and (B) Guts Setups. PE MPs submerged in the agarose gel appeared as dark regions, visible as black spots in the data. A′ and B′ provided a closer view. Selected MPs are highlighted with yellow arrows to indicate their location in the dataset.
Acknowledgments
This image is the copyrighted work of the attributed author or publisher, and
ZFIN has permission only to display this image to its users.
Additional permissions should be obtained from the applicable author or publisher of the image.
Reprinted from Journal of hazardous materials, 488, Parobková, V., Maleček, L., Zemek, M., Kalčíková, G., Vykypělová, M., Buchtová, M., Adamovský, O., Zikmund, T., Kaiser, J., Advancing microplastic detection in zebrafish with micro computed tomography: A novel approach to revealing microplastic distribution in organisms, 137442137442, Copyright (2025) with permission from Elsevier. Full text @ J. Hazard. Mater.