
Fig. 6
- ID
- ZDB-IMAGE-250421-78
- Publication
- Huybrechts et al., 2025 - Loss of the Ubiquitin-Associated Domain of sqstm1/p62 in Zebrafish Causes a Phenotype Resembling Paget's Disease of Bone
- All Figures
- Figures for Huybrechts et al., 2025
|
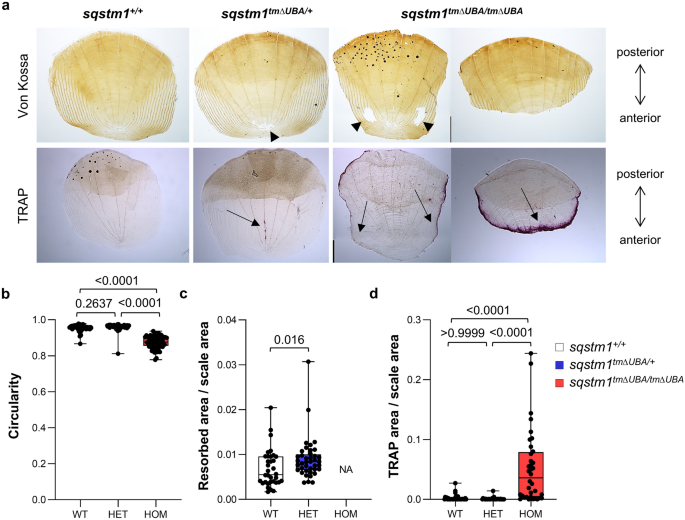
Fig. 6 Osteoclast histomorphometry in scales from wild-type and sqstm1tmΔUBA zebrafish at 6 mpf. a Representative images of Von Kossa (top row) and TRAP staining (bottom row) of elasmoid scales from 2 different sqstm1+/+, sqstm1tmΔUBA/+ and sqstm1tmΔUBA/tmΔUBA at 6 mpf. Non-mineralization, i.e., bone resorption and TRAP-positivity are shown by arrowheads and arrows, respectively. Black spots indicate staining artifacts. b Quantification of circularity, c relative resorbed area over total scale area, and d relative TRAP-stained area over total scale area. Each data point represents an individual scale. n = 4 zebrafish/genotype and n = 9 (on average) scales/zebrafish/staining. Statistical analysis was performed using Kruskal–Wallis Tests/Mann–Whitney U Tests. WT wild type (sqstm1+/+), HET heterozygous mutant (sqstm1tmΔUBA/+), HOM homozygous mutant (sqstm1.tmΔUBA/tmΔUBA)