
IMAGE
Figure 7
- ID
- ZDB-IMAGE-250419-19
- Publication
- Su et al., 2025 - Tekt3 Safeguards Proper Functions and Morphology of Neuromast Hair Bundles
- All Figures
- Figures for Su et al., 2025
Image
|
Figure Caption
Figure 7
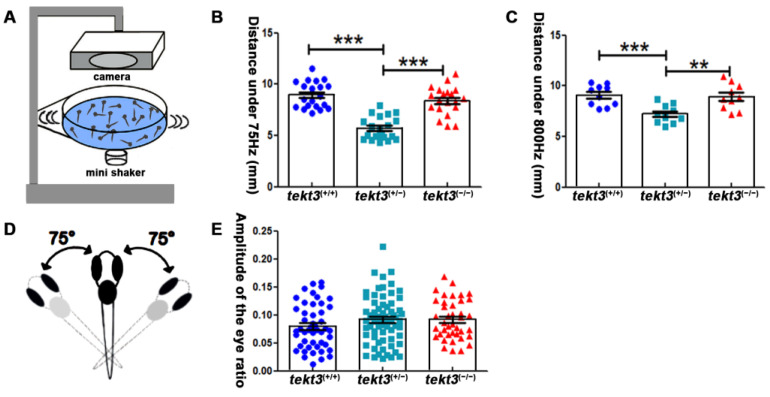
Heterozygous
Figure Data
Acknowledgments
This image is the copyrighted work of the attributed author or publisher, and
ZFIN has permission only to display this image to its users.
Additional permissions should be obtained from the applicable author or publisher of the image.
Full text @ Int. J. Mol. Sci.