
IMAGE
Fig. 9
- ID
- ZDB-IMAGE-250416-86
- Publication
- Yang et al., 2025 - Crip2 affects vascular development by fine-tuning endothelial cell aggregation and proliferation
- All Figures
- Figures for Yang et al., 2025
Image
|
Figure Caption
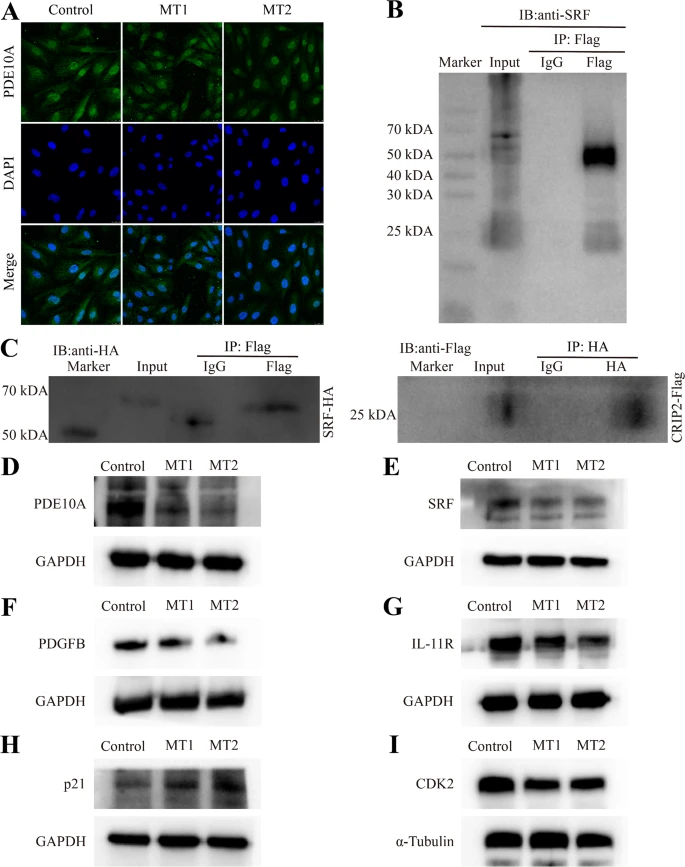
Fig. 9 SRF interacts with CRIP2, and the expression of its downstream genes is modulated by CRIP2. (A) Immunofluorescence analysis of PDE10A expression after CRIP2 depletion. DAPI was used to stain the nucleus. (B) Detection of SRF in the immunoprecipitation derived from cell lines overexpressing CRIP2. (C) CRIP2 coimmunoprecipitates with SRF. (D–I) Analysis of the altered protein levels of PDE10A, SRF, PDGFB, IL-11R, p21, and CDK2 in response to CRIP2 deficiency
Acknowledgments
This image is the copyrighted work of the attributed author or publisher, and
ZFIN has permission only to display this image to its users.
Additional permissions should be obtained from the applicable author or publisher of the image.
Full text @ Cell. Mol. Life Sci.