
|
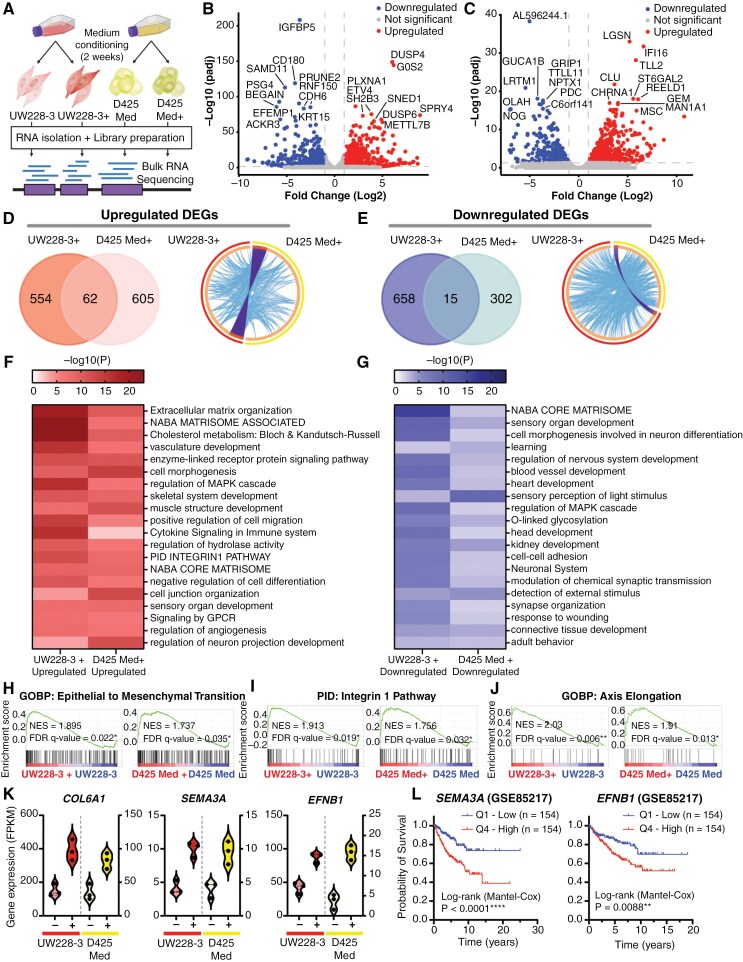
Fig. 5 Transcriptomic analysis reveals upregulation of genes associated with cancer stemness and migration. (A) Schematic overview of the bulk RNA sequencing protocol. (B) Volcano plot showing all differentially expressed genes (DEGs) upon comparison of the transcriptome of UW228-3 with UW228-3 in complete neural stem cell medium (+), or (C) D425 Med with D425 Med cultured in complete neural stem cell medium (+). Gene names of the top 20 most significant DEGs are shown. Significant DEGs are those with a fold change of ≥ 2 (Log2FC ≥ 1) and an adjusted P-value of ≤ .05. Blue dots (left side) represent downregulated genes and red dots (right side) represent upregulated genes. (D) Left panel: Venn diagram showing overlap between the upregulated and (E) downregulated DEGs in UW228-3+ and D425 Med+. Right panel: Circos plots displaying the gene overlap and shared term level between the gene lists UW228-3 versus UW228-3+ and D425 Med versus D425 Med+. Purple lines link identical genes and blue lines link genes that belong to the same enriched ontology term. The inner circle represents the 2 gene lists, whereas the outside circle represents the group. (F, G) Heatmaps of enriched gene set terms shared across both gene lists, colored by P-values. Each term represents a cluster of multiple associated gene sets. Clusters were named after the most significantly expressed gene set present in both gene lists. (H–J) Epithelial to mesenchymal transition, integrin-1 pathway, and axis elongation are all significantly enriched in both UW228-3 and D425 Med when cultured in complete neural stem cell medium (+) as observed upon GSEA analysis. (K) Violin plots showing the DEGs COL6A1, SEMA3A, and EFNB1 that are significantly enriched in both UW228-3+ and D425 Med+, expressed as fragments per kilobase (FPKM). (L) Kaplan–Meier curves represent the survival of MB patients with low expression (Q1) compared with MB patients with high expression (Q4) of SEMA3A or EFNB1.