
|
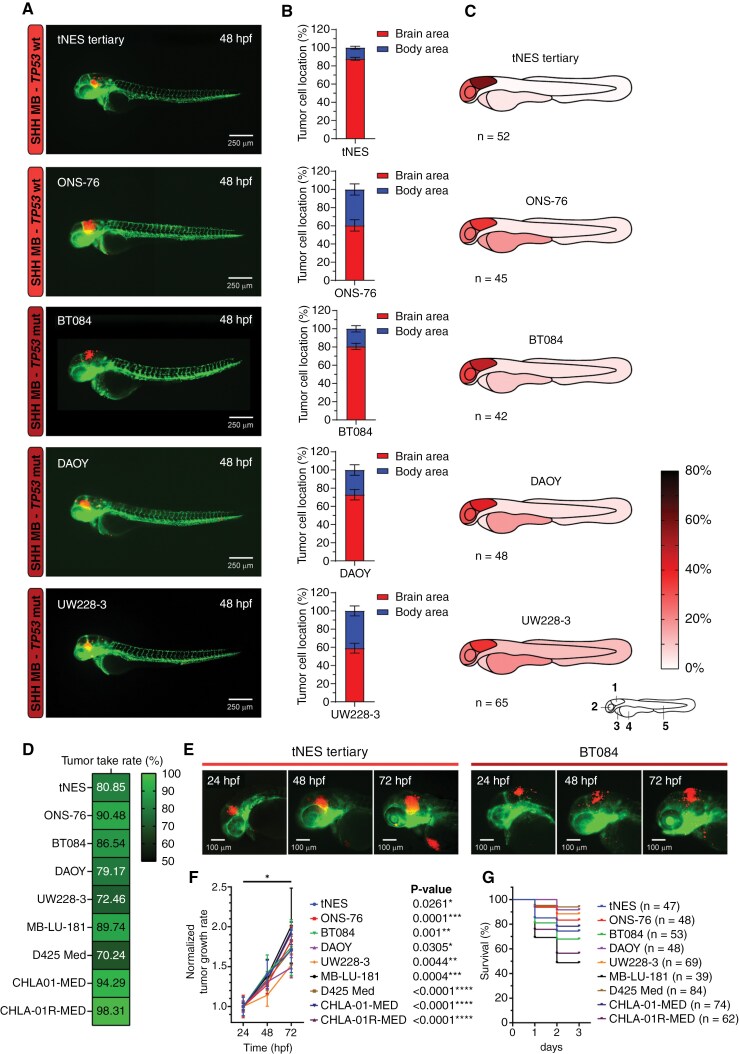
Fig. 2 SHH medulloblastoma cell lines home toward the hindbrain region after transplantation into the blastula stage of zebrafish embryos. (A) Representative images of fli1:EGFP zebrafish embryos 48 hpf transplanted with SHH medulloblastoma (MB) cell lines. (B) Brain/body area distribution of transplanted SHH MB cell lines in 48 h old embryos (tertiary tNES n = 52, ONS-76 n = 45, BT084 n = 42, DAOY n = 48, and UW228-3 n = 65). Mean ± SEM. (C) Schematic heatmaps of the tumor cell location of SHH MB cell lines in 48 h old embryos. 1 = hindbrain area; 2 = mid/forebrain area; 3 = pericardium area; 4 = yolk sac area; 5 = body and tail area. (D) Tumor take rates (%) of all transplanted MB cell lines. (E) Representative images of tumor growth (tertiary tNES and BT084) from 24 hpf to 72 hpf. (F) Tumor growth rate and (G) survival rate analyses of all transplanted MB cell lines. Kaplan Meier curves represent the survival rate of transplanted zebrafish embryos up to 72 hpf.