
|
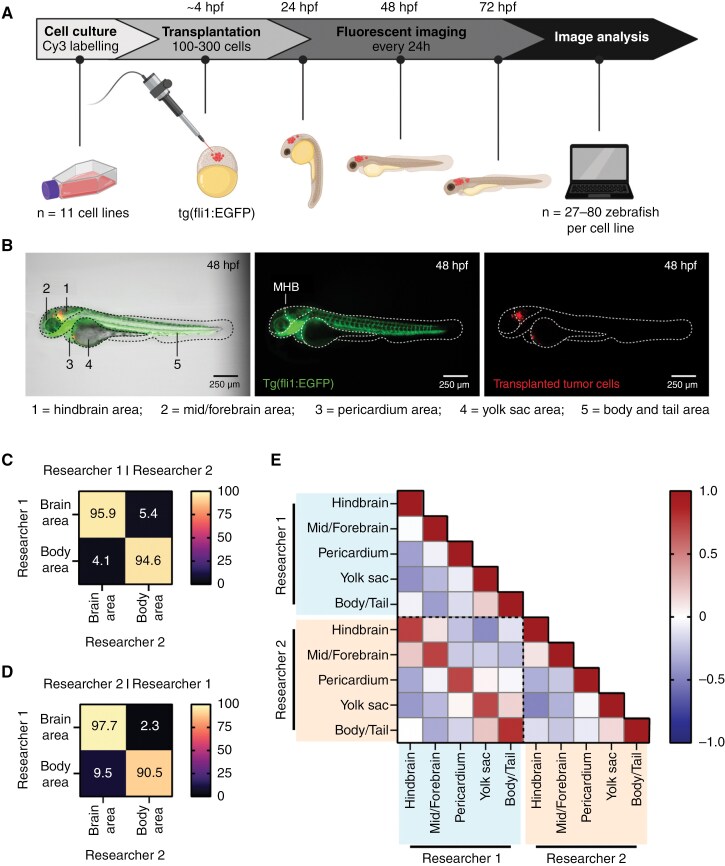
Fig. 1 Homing of fluorescently labeled tumor cells transplanted in zebrafish embryos can be examined with fluorescent imaging and image analysis. (A) Schematic overview of the experimental workflow for zebrafish embryo transplantations followed by tumor location analysis. (B) Representative image of a tertiary tNES cell transplanted zebrafish embryo 48 h post-fertilization (hpf), displaying the 5 defined locations for location analysis. Left panel: bright field with GFP and Cy3 overlay. Middle panel: expression of enhanced GFP in the vasculature of the fli1:EGFP zebrafish embryo (GFP, green). MHB = mid-hindbrain boundary. Right panel: labeled tumor cells (Cy3, red). (C) Confusion matrices of image classification performed by researcher 1, (D) and researcher 2. (E) Pearson correlation matrix between the analyzed datasets of researcher 1 and researcher 2 revealing high correlation between individually analyzed datasets.