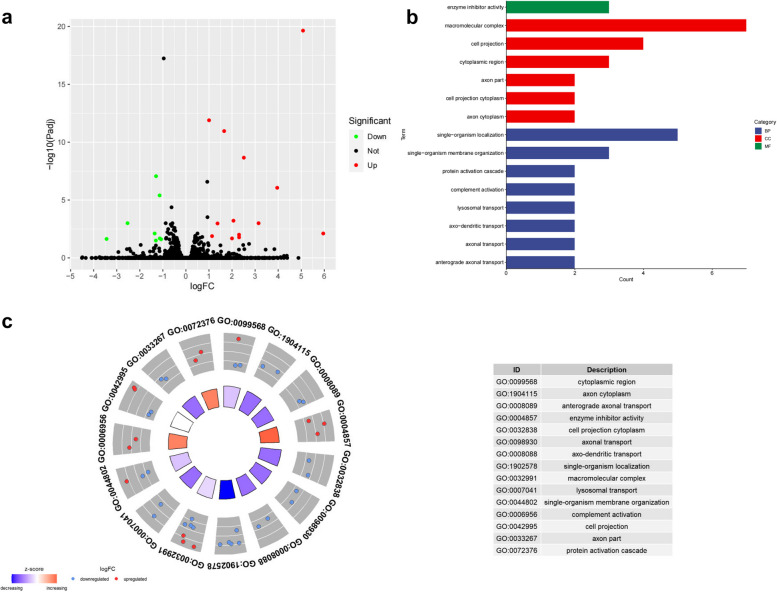
RNAseq analysis of spout1-knockout zebrafish. a Volcano map of gene expression changes after spout1 knockout. Red dots represent up-regulated genes. Green dots represent downregulated genes. b Significantly enriched GO terms, which were grouped into three categories: molecular function (MF), cellular component (CC) and biological process (BP). c GOCircle plot based on the GOplot analysis of enriched GO term. The inner ring is a barplot where the height of the bar indicates the significance of the GO term (-log10 |P-value|), and color corresponds to the z-score, which indicates increase (red) or decrease (blue). The outer ring displays scatterplots of the expression levels (logFC) of the genes in each term
Acknowledgments
This image is the copyrighted work of the attributed author or publisher, and
ZFIN has permission only to display this image to its users.
Additional permissions should be obtained from the applicable author or publisher of the image.
Full text @ Acta Epileptol
Your Input Welcome
Thank you for submitting comments. Your input has been emailed to ZFIN curators who may contact you if
additional information is required.
Oops. Something went wrong. Please try again later.