
FIGURE 6
- ID
- ZDB-IMAGE-250411-7
- Genes
- Publication
- Strachan et al., 2025 - Novel in vivo models of autosomal optic atrophy reveal conserved pathological changes in neuronal mitochondrial structure and function
- All Figures
- Figures for Strachan et al., 2025
|
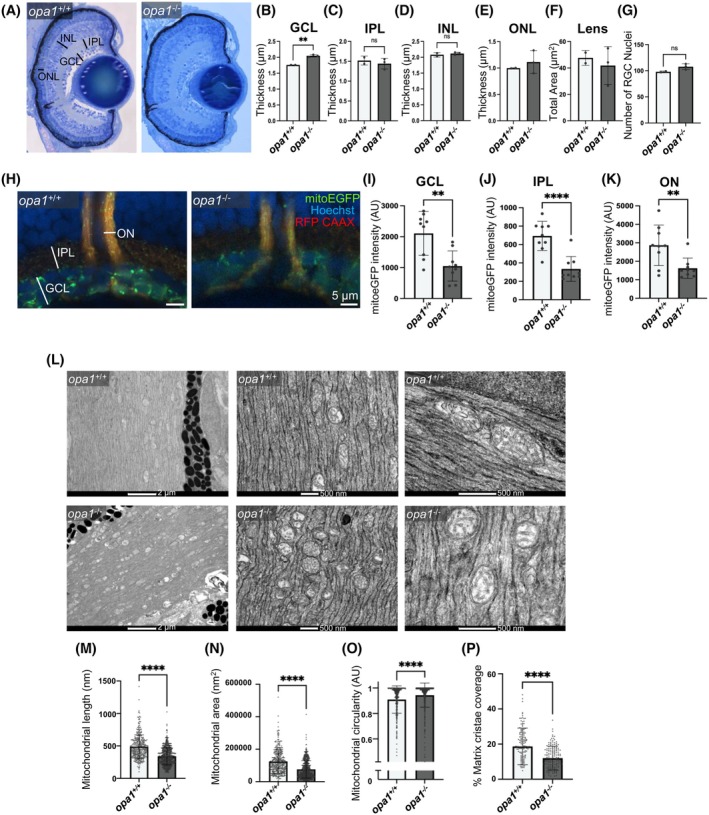
FIGURE 6
Loss of Opa1 disrupts mitochondrial morphology within RGC axons in zebrafish. (A–F) Cellular lamination is comparable in opa1−/− larvae and opa1+/+ siblings. (A) Representative images of toluidine blue stained retinal sections from <131 hpf zebrafish. Retinal layers indicated. Graphs represent mean ± SD thickness in μm of GCL (B), IPL (C), INL (D), ONL (E) and total area (μm2) of the Lens (F). (G) Graph represents mean ± SD number of RGC nuclei. (H–K) mitoEGFP staining is significantly decreased in