
Fig. 4
- ID
- ZDB-IMAGE-250408-39
- Publication
- Deis et al., 2024 - Genetic control over biogenic crystal morphogenesis in zebrafish
- All Figures
- Figures for Deis et al., 2024
|
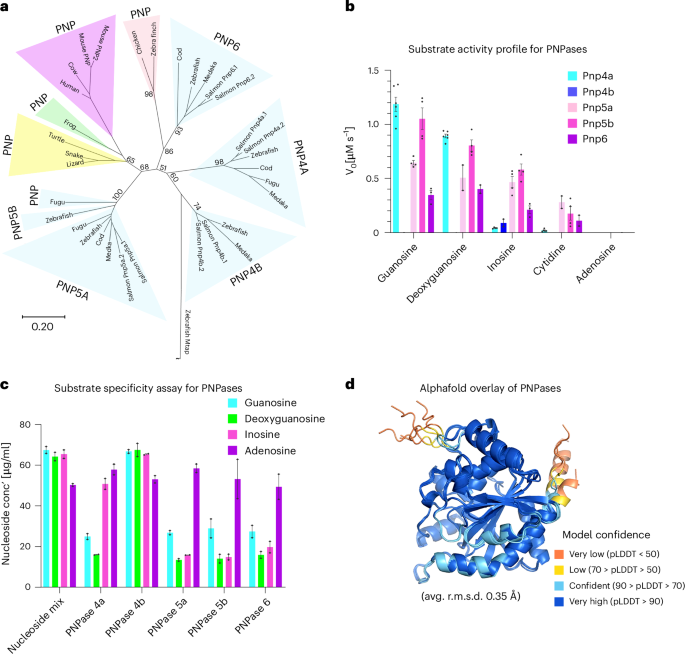
Fig. 4 a, Phylogenetic analysis of the vertebrate PNPase protein family. Clades are highlighted in the background, with their phylogenetic classes color-coded: blue for fish, green for amphibians, light pink for birds, yellow for reptiles and pink for mammals. Species abbreviations: salmon, Atlantic salmon; cod, Atlantic cod; lizard, green anole; turtle, painted turtle; snake, eastern brown snake; frog, African clawed frog; medaka, Japanese rice fish. The MTAP protein served as an outgroup. b, Enzymatic activity assays of the zebrafish PNPase family using different nucleosides as substrates. The mean ± s.e.m. are shown for at least duplicates, where each data point represents an independent biological repeat. c, Substrate competition experiments, in which residual nucleoside concentrations were determined for each enzyme using LC–MS following a 30-min incubation with the specified nucleoside mixture. The mean ± s.e.m. are shown for independent biological duplicates. d, An overlay of the structures of PNPases 4a, 4b, 5a, 5b and 6 predicted by AlphaFold2 (refs. 50,52). pLDDT, predicted local distance difference test.